
Celebrating 25 years of DDD's Excellence and Social Impact.

Uncategorized

Digitize Historical Records

How to Digitize Historical Records for AI-Powered Search and Discovery

Historical records digitization converts physical archives, bound volumes, handwritten manuscripts, and legacy microfilm into digital assets that can be searched, cross-referenced, and analyzed at scale. The output that makes this valuable is not the scanned image. It is the searchable text and structured metadata, layered on top of it, since an archive of high-resolution photographs of old documents is not meaningfully more discoverable than the physical originals; a researcher, genealogist, or AI system still has to look at every image to find anything.

This blog covers what historical records digitization actually involves: the recognition challenges specific to historical material, how AI-powered search differs from simple full-text search, the metadata and interoperability standards that make an archive discoverable beyond its own walls, and how quality gets validated for material where there is often no second copy to check against. AI data preparation services and text annotation services are the two capabilities most directly involved.

Key Takeaways

  • A scanned image is not a discoverable record. Discoverability comes from the text layer and structured metadata built on top of the image, not from the image itself; archives with high-quality scans but no extraction remain effectively unsearchable.
  • Historical material breaks generic OCR in specific, recurring ways. Period typefaces, handwriting, faded ink, damaged pages, and layout conventions that no longer exist all require recognition models trained on the material’s actual characteristics, not a general-purpose engine.
  • Search tolerance is not the same as transcription tolerance. A recognition error rate that would be unacceptable for a scholarly transcription can still make a document findable, which means digitization programs should set different quality bars for search versus publication.
  • Metadata is what makes an archive discoverable beyond its own catalog. Structured, standards-based metadata is what lets a historical collection surface in cross-institutional search and AI-powered discovery tools, not just its own internal database.
  • Validation works differently when there is no second copy. Historical originals are often unique, so quality assurance has to rely on statistical sampling, cross-referencing against related records, and confidence-based routing rather than checking against a duplicate source.

Why Historical Material Breaks Generic Recognition Tools

The Recognition Challenge Is Not One Problem

Modern document OCR is tuned for a narrow, consistent case: printed text, standard fonts, clean scans. Historical material violates nearly every one of those assumptions at once. Typefaces from earlier printing eras, Fraktur being a well-documented example, use letterforms a modern model never trained on. Handwriting varies by individual, era, and region, and a single archive can span decades of different hands. Physical degradation obscures characters that were perfectly legible when written: foxing, fading, water damage, torn pages. And layout conventions from earlier eras confuse extraction logic built around modern document layouts, from marginal annotations to non-standard abbreviations and inconsistent column structures.

Why Purpose-Trained Models Outperform Generic Ones Here

The Vienna City Library case illustrates the mechanism precisely: the same records that generic OCR could not read became a searchable 200,000-page archive once a model was trained specifically on Fraktur script. This is the pattern across historical digitization generally. A recognition model trained on the specific typeface, hand, or layout convention in an archive substantially outperforms a general-purpose model on that archive, because historical material is exactly the kind of narrow, consistent-within-itself distribution that benefits most from targeted training, even though it looks wildly inconsistent across different archives.

What AI-Powered Search Actually Requires Beyond Basic OCR

From Transcription to Structured, Searchable Data

Raw transcribed text supports simple keyword search and little else. AI-powered search and discovery requires a further structuring layer: named entities such as people, places, and dates extracted and normalized so that a search for a person finds them under name variants and spelling changes across decades, document types classified so results can be filtered meaningfully, and relationships between records, a marriage record linked to the birth records it produced, surfaced rather than left implicit. This structuring work is what separates a full-text-searchable archive from one that actually supports the kind of exploratory discovery historians, genealogists, and AI research assistants are trying to do.

Search Tolerance Versus Transcription Tolerance

A distinction worth making explicit because it changes program economics: the accuracy bar for making a document findable is measurably lower than the bar for a publishable scholarly transcription. Practitioner findings in the field note that recognition results with a meaningfully elevated character error rate can still support successful keyword search, because search tolerates errors that transcription cannot. Directionally, well-trained handwriting models on consistent hands can reach character error rates in the low single digits, while a search-enablement pass can remain useful at error rates several times higher; a scholarly transcription target sits near the former, not the latter. A digitization program that sets a single accuracy target for the whole archive is usually over-investing in some material and under-investing in other material relative to what each actually needs. Setting separate bars, a lower one for search-enablement passes across the bulk of an archive and a higher one for material selected for full transcription or publication, gets more of the archive searchable faster without lowering quality where it actually matters.

Metadata and Interoperability: Discoverable Beyond Your Own Catalog

An archive that is searchable only within its own institution’s website has solved half the discoverability problem. IIIF (the International Image Interoperability Framework), now used across libraries, archives, and museums internationally, defines a standard way to describe, share, and interoperate with digitized images so that a researcher’s tool or an AI system can query across multiple institutions’ collections as though they were one archive. Building a digitization program around a proprietary internal format may satisfy immediate needs, but it forecloses that cross-institutional discoverability later, and retrofitting standards compliance onto an existing archive is markedly more expensive than building to the standard from the start.

Validating Quality When the Original Is Often Unique

Financial and business document digitization can validate output against clean structured data or known totals. Historical records frequently cannot: the physical original is often the only copy in existence, degrading further with each handling, which means validation has to work without a clean second copy to check against. The practical approach combines three methods. Statistical sampling measures the model against expert-reviewed ground truth on a representative slice of the archive. Confidence-based routing sends low-certainty pages to human review rather than accepting the model’s output uniformly. Cross-referencing checks output against related records where they exist. A parish register entry checked against a corresponding civil record, for instance, can catch errors neither record alone would reveal.

How Digital Divide Data Can Help

Whether a digitization program builds this capability internally or with a partner, the same components decide whether an archive becomes genuinely discoverable: recognition trained on the material’s actual characteristics, structured metadata built to interoperable standards, and validation that works without a clean second copy. Producing those at archive scale is the work we do.

The recognition layer: AI data preparation trains capture and extraction on your archive’s specific typefaces, hands, and layouts, with confidence-based routing so uncertain pages reach human review instead of the corpus.

The structuring layer: text annotation teams handle named entity extraction and normalization, document classification, and the standards-based metadata that makes a collection discoverable beyond its own catalog.

If your assessment starts with two questions, what does the archive’s material actually look like, and who else needs to find it, that is the assessment we run. Talk to an expert.

Conclusion

Historical records digitization succeeds when it treats the scan as a starting point rather than the deliverable. The archives that become genuinely discoverable are the ones where recognition was trained on the material’s actual characteristics rather than a generic engine, where structuring turned raw text into searchable entities and relationships, and where metadata was built to standards that let the archive surface beyond its own catalog.

The clarifying question for any historical digitization program is direct: if a researcher searched for a specific person, place, or event tomorrow, would your archive surface the answer, or would it hand back a stack of correctly scanned images they still have to read one by one?

References

READ-COOP. (2026). Transkribus: AI-powered text recognition for handwritten and historical documents. https://readcoop.eu/transkribus/

International Image Interoperability Framework (IIIF) Consortium. (2026). IIIF: International Image Interoperability Framework. https://iiif.io/

Frequently Asked Questions

Q1. Our archive is already scanned at high resolution. Isn’t that most of the work done?

Scanning is necessary and it is also the smaller half of the value creation. A high-resolution scan is a precondition for recognition, not a substitute for it, and an archive of beautifully scanned images with no extracted text or metadata remains exactly as unsearchable as the physical originals, just more convenient to look at one page at a time. As a directional planning figure, scanning and image capture often account for roughly 30 to 40 percent of total program cost for archives with significant handwritten or period-typeface content; recognition, entity extraction, and standards-based metadata make up the rest, and they are where discoverability is actually created. Budgets built as if scanning were the program tend to discover the larger half after the scanner is paid for.

Q2. How do we prioritize which parts of a large historical archive to digitize first?

Weigh research and public demand against physical risk, with physical risk overriding when material is actively deteriorating. Material with documented high research or public interest, frequently requested collections, records tied to significant historical events or well-known genealogical lines, delivers return fastest and helps justify the program’s continuation. Material in poor physical condition should be prioritized regardless of current demand, because its loss is irreversible and demand for historical material shifts over time in ways that are hard to predict from today’s request logs. Material with low current demand and stable physical condition can reasonably wait, provided it is cataloged and its condition is monitored so deterioration doesn’t go unnoticed.

Q3. What accuracy rate should we target for handwritten historical material?

Set the target to the use case, not to a single archive-wide number. For search-enablement passes, where the goal is making documents findable rather than perfectly transcribed, meaningfully elevated error rates remain acceptable, since search tolerates errors that scholarly reading does not. For material selected for publication, scholarly citation, or legal use, the bar should be substantially higher and typically requires human review and correction rather than accepting model output as final. Measuring and reporting accuracy separately by document type, era, and hand, rather than as one archive-wide average, is what makes it possible to know which material needs the higher bar and which has already cleared the lower one.

Q4. Should we build our own search interface or rely on standards like IIIF for discoverability?

Both, and they serve different audiences. A dedicated search interface tailored to your archive’s specific structure and your users’ research patterns delivers a better experience for people who come directly to your institution. IIIF compliance is what makes your archive discoverable to researchers and AI-powered tools that are searching across multiple institutions rather than starting at any one of them, which is an increasingly common way scholarly and genealogical research actually happens. Building to IIIF standards from the start costs relatively little more than a fully proprietary approach and avoids a substantially more expensive retrofit later, so the practical recommendation is a custom interface built on top of a standards-compliant underlying structure, not one instead of the other.

Q5. How do we validate transcription accuracy when there’s no second copy of the original to check against?

Statistical sampling against expert human review is the core method: pull a representative sample across document types, eras, and hands, have a qualified reviewer transcribe or verify it independently, and measure the recognition model’s output against that sample rather than attempting to validate every page. Confidence scores from the recognition model itself provide a second signal, routing low-confidence pages to human review regardless of where they fall in the sample. And where related records exist, a baptismal record cross-checked against a corresponding marriage or death record, for instance, discrepancies between them can surface recognition errors that neither record’s isolated review would catch. None of these substitutes for a true second copy, but combined, they produce a defensible accuracy estimate without one.

How to Digitize Historical Records for AI-Powered Search and Discovery Read Post »
A Step-by-Step Guide to Building AI DataOps

How to Build an AI Data Operations Function: A Guided Framework

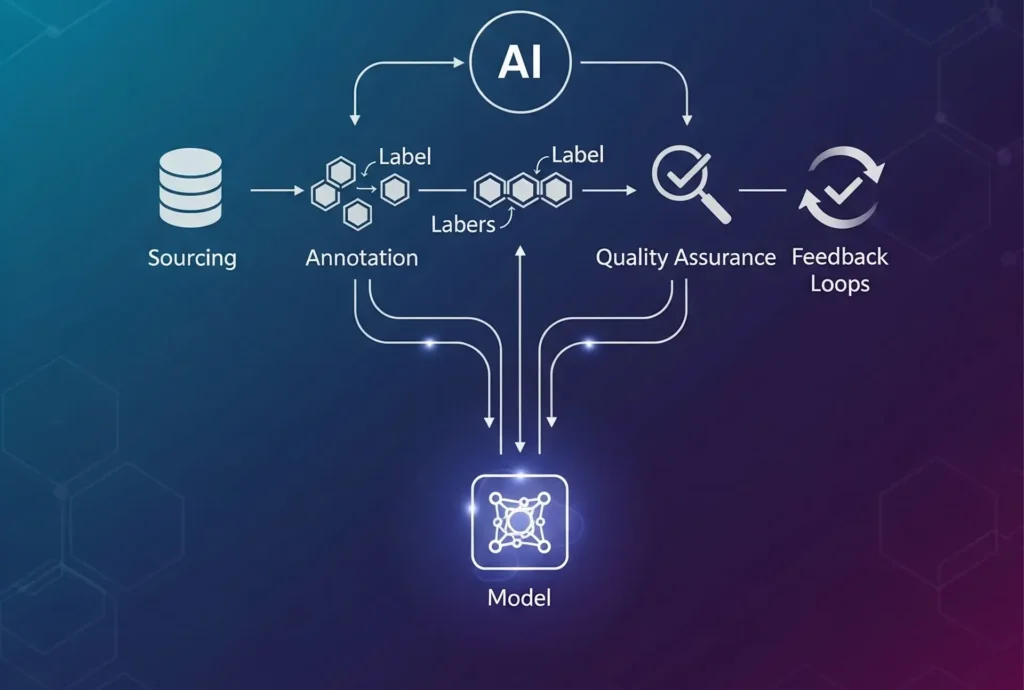
Building an AI data operations services function means standing up a repeatable system that moves training and evaluation data from sourcing through annotation, quality assurance, and back into the model, continuously and at scale. The implementation sequence is consistent; assign a single accountable owner, define the three operating layers (acquisition, annotation, quality and feedback), select tooling around dataset versioning and lineage, automate the annotation pipeline where automation is reliable, and track KPIs that tie data work to model behavior. Most programs fail not because of weak models but because this actual operating structure is missing.

The pressure to formalize this function is measurable. A 2025 S&P Global survey of more than 1,000 enterprises found that 42% of companies abandoned most of their AI initiatives that year, up from 17% the prior year, and the organizations that succeeded were the ones that redesigned their end-to-end workflows rather than swapping models. A standing AI data operations function is what that redesign looks like in practice. It is the difference between a one-time labeled dataset and a persistent data supply chain. Strong data collection and curation services feed the front of that chain, while reliable AI data pipeline infrastructure carries data through it without manual rework at every handoff.

Key Takeaways 

  • AI data operations is the system that keeps the right data flowing to your models continuously, not just once at the start of a project.
  • Start by putting one person clearly in charge, someone who can look at a model failure and trace it back to a data problem they’re allowed to fix.
  • Set up the work in three clear stages; getting the data, labeling it, and checking quality while feeding lessons back into the process.
  • Automate the easy, repetitive parts, but keep people involved in the tricky or high-stakes cases instead of automating everything.
  • Track whether your data work is actually improving the model, not just how fast you’re labeling things.
  • The companies that succeed, treat data as an ongoing supply they manage, while the ones that fail keep reacting to problems after they appear.

What is an AI data operations function and why does it need its own structure?

AI data operations, often shortened to AI DataOps, is the operating model, team structure, tooling conventions, and governance that manage the continuous flow of training and evaluation data through an AI program. It borrows the discipline of DevOps, automation, version control, testing, and continuous delivery, and applies it to data work rather than code. The function spans the full lifecycle, so continuous model evaluation sits at one end and human preference optimization workflows feed back into it. The goal is simple to state and hard to sustain; deliver the right dataset, with known quality, to every training and evaluation run.

It needs its own structure because annotation alone does not scale into reliable model behavior. Annotation is one layer of the system. Around it sits sourcing, quality measurement, dataset versioning, and the feedback path that turns evaluation findings into specific data fixes. When those surrounding parts are informal, scale amplifies whatever inconsistency already exists. A small team with vague guidelines produces a manageable amount of noise, while a large one produces noise faster than anyone can correct it.

The distinction matters for planning. A proof-of-concept can run on a single curated dataset and an informal labeling group. A production program that requires continuous fine-tuning, preference optimization, and safety evaluation needs a persistent data supply chain instead. For a stronger understanding of the conceptual fundamentals behind this AI data operating model, it is important to first look at the core layers, ownership structure, and accountability questions that define AI data operations.

How do I set up an AI data operations function step by step?

Setting up the function is a sequence, not a single hire or a tool purchase. The order matters because each step depends on the one before it. Standing up tooling before assigning an owner, for example, produces a stack that nobody is accountable for. The following sequence works for teams moving from pilot to production.

  • Assign a single accountable owner: Name one person, usually the AI program lead or a Head of AI Data, who can trace a model failure to a specific data problem and authorize the work to fix it. This accountability role must sit inside the organization even when execution is outsourced.
  • Define the three operating layers: Separate acquisition and sourcing, annotation and labeling, and quality assurance with feedback integration. Each layer has its own inputs, outputs, and quality checks, so treating them as one blurred process is where most early programs lose traceability.
  • Establish a sourcing strategy before labeling: Decide what data you need, where it comes from, and how representativeness is verified. A deliberate data collection strategy for AI training prevents the common failure of labeling large volumes of data that do not reflect the target distribution.
  • Select tooling around versioning and lineage: Pick orchestration, annotation, and observability tools that can track which dataset version fed which training run. Lineage is the feature that makes everything downstream debuggable.
  • Automate the annotation pipeline where automation is reliable: Use model-assisted pre-labeling and automated checks for the predictable cases, and route ambiguous or safety-critical cases to human review.
  • Close the feedback loop with evaluation: Wire evaluation findings back into data remediation so that a regression triggers a targeted dataset fix rather than a vague request for more labels.

This ordering reflects a finding that holds across the research. McKinsey’s 2025 State of AI survey reports that organizations seeing real bottom-line impact are far more likely to have fundamentally redesigned their workflows rather than bolting AI onto existing processes. An AI data operations function is workflow redesign applied to the data layer specifically.

What roles belong on an AI data operations team?

The team is cross-functional, but a few roles carry the function. The most underrated of them is the accountable owner described above, because without it the team stays reactive. The remaining roles divide cleanly between building the pipeline and producing the data that flows through it. Data engineering has become central enough that successful AI enterprises treat data engineering as a core AI competency rather than a supporting function.

  • AI data operations lead (accountable owner): Translates model failures into data remediation actions and owns the build-versus-buy decision.
  • Data / DataOps engineer: Builds and maintains pipeline infrastructure, automation, lineage tracking, and the templates other contributors follow.
  • Annotation lead and quality lead: Own annotation guidelines, taxonomy decisions, and inter-annotator agreement targets.
  • Annotation workforce (internal or partner): Produces the labels, ideally with continuous rather than burst capacity.
  • Evaluation consumer: The model training and evaluation team that uses the data and feeds findings back into it.

Two organizational patterns are common, and choosing between them early avoids rework. In a central platform model, one team builds shared tooling and standards while domain teams own their pipelines on that foundation. In an embedded model, data operations specialists sit inside each domain and keep consistency through shared practice. Teradata’s analysis of DataOps team structures describes both patterns and the tradeoff between centralized control and domain proximity.

What tools support an AI data operations function?

Tooling should be selected by capability category, not by brand. The function needs four categories working together, and the connective tissue across all of them is dataset versioning and lineage. Without lineage, a quality problem becomes a guessing exercise instead of a lookup.

  • Orchestration: Schedules jobs, manages dependencies between pipeline steps, retries failures, and triggers downstream work automatically.
  • Annotation and labeling platforms: Support the data modalities you work in, model-assisted pre-labeling, and reviewer workflows.
  • Observability and quality monitoring: Track pipeline health, schema changes, and label quality, and surface anomalies before they reach a training run.
  • Versioning and lineage: Record which dataset version, sourced how and labeled by whom, fed each fine-tuning or evaluation job.

For multimodal programs spanning text, image, video, and audio, the annotation platform decision is heavier because each modality carries its own tooling and quality conventions. The broader AI data pipeline layer is where orchestration and lineage are operationalized as delivered infrastructure rather than a stack you assemble alone.

How do I automate AI data and annotation pipelines?

Automation in AI data operations is not the same as full automation. The aim is zero-touch operation for the standard, predictable cases and fast, informed human intervention for the exceptions. Applied to annotation specifically, that means automating the parts that are reliable and reserving human judgment for the parts that are not. The strength of a multi-layered annotation pipeline lies in how well it combines automated stages with human judgment while maintaining quality, consistency, and control.

A practical automation sequence looks like this. First, automate ingestion and validation so that incoming data is checked against schema and quality rules at the door, which prevents broken pipelines downstream. Second, apply model-assisted pre-labeling so annotators correct machine output rather than starting from scratch, which raises throughput without raising error rates if review is enforced. Third, automate quality testing so that label distributions, agreement scores, and edge-case coverage are monitored continuously instead of audited occasionally.

The boundary of automation is the point worth getting right. Predictable, high-volume cases are good automation candidates, while ambiguous, rare, or safety-critical cases should route to human reviewers by design. Automating those amplifies error instead of removing it, which is why the strongest pipelines treat human-in-the-loop review as a permanent design feature, not a temporary crutch to be removed once volume grows.

How should quality governance and vendor integration work?

Quality governance is what keeps the function honest as it scales. Three practices separate mature programs from those stuck in pilot mode, and none of them are complicated in principle. Every dataset delivered to a training run is versioned with clear lineage from source through annotation. When a model regresses, the team can isolate which dataset version and which annotation cohort were involved without losing time. And evaluation findings drive data remediation as a standing practice rather than an occasional cleanup.

Quality targets need to be concrete rather than aspirational. Inter-annotator agreement, edge-case coverage, and a defined accuracy threshold give the function something to measure against. However, a headline number like 99.5% accuracy can be misleading without the right context. In production, data annotation accuracy, depends on the denominator being measured, the types of errors being counted, and how those errors affect downstream model performance.

Vendor integration is partly a governance decision. The build-versus-buy-versus-partner question is really about which capabilities the internal accountability structure must own and where external execution capacity makes more sense. The accountable owner stays internal in every pattern. Execution work such as sourcing, labeling, and quality assurance can be partnered, provided the partner plugs into the same lineage and quality standards rather than running a parallel, opaque process. The integration pattern that works treats a partner as an extension of the pipeline, with shared versioning, shared quality definitions, and shared visibility into agreement metrics.

What KPIs should I track for AI data operations?

KPIs for AI data operations should connect data work to model behavior, not just measure labeling speed. Throughput matters, but a fast pipeline producing inconsistent labels is a faster route to a failed model. Track a small, balanced set across quality, flow, and impact.

  • Inter-annotator agreement: The consistency of labels across annotators, the leading indicator of dataset reliability.
  • Annotation accuracy against gold standard: Measured on a held-out, expert-labeled set with a clear error definition.
  • Edge-case and distribution coverage: How well the dataset represents the target distribution, including rare but important cases.
  • Dataset lineage completeness: The share of training datasets with full, traceable provenance from source to training run.
  • Cycle time and rework rate: How long data takes to move through the pipeline and how often it must be redone.
  • Evaluation-to-remediation time: How quickly an evaluation finding becomes a shipped data fix, the clearest signal that the feedback loop is closed.

The last metric is the one that distinguishes a real operating function from a labeling vendor relationship. A program that can measure how fast a model failure turns into a corrected dataset has the feedback loop working. A program that cannot is still treating data as a one-time input rather than a continuously managed supply.

How Digital Divide Data Can Help

Digital Divide Data operates the execution layers of AI data operations as managed services, which lets the internal accountability owner stay focused on tracing model failures to data fixes. On the sourcing side, DDD’s data collection and curation services build representative, AI-ready datasets rather than large volumes of poorly targeted data. For labeling across text, image, video, and audio, DDD’s multimodal data annotation services bring inter-annotator agreement discipline and reviewer workflows to each modality’s specific conventions.

On the feedback side, DDD’s model evaluation services produce the findings that drive targeted data remediation, closing the loop between how a model behaves and what data work happens next. Preference data work, including RLHF and DPO optimization, is run with the same versioning and quality standards as the rest of the pipeline, so a partner becomes an extension of your operating model rather than a parallel process you have to reconcile.

The integration pattern is deliberate. DDD plugs into shared dataset lineage and shared quality definitions, so visibility into agreement metrics and dataset provenance stays with your team. That is what makes the build-versus-buy-versus-partner decision a question of capacity rather than control.

Stand up an AI data operations function that actually closes the gap between pilots and production. Talk to an Expert!

Conclusion

An AI data operations function is the operating system for a production AI program. The implementation sequence is consistent and unglamorous: name an accountable owner, separate the three layers, source deliberately, version everything, automate the reliable parts, and route the hard cases to people. The organizations that treat data as a continuously managed supply chain are the ones moving models from pilot to production, while the organizations still labeling in bursts and reacting to regressions are well represented in the share of AI initiatives quietly abandoned each year.

The gap between those two groups is not model sophistication. It is whether a model failure can be traced to a dataset version and fixed on purpose, or whether it triggers another round of guessing. Building the function correctly is what makes that traceability routine. 

References

S&P Global Market Intelligence. (2025). AI experiences rapid adoption, but with mixed outcomes: Highlights from VotE: AI & Machine Learning. https://www.spglobal.com/market-intelligence/en/news-insights/research/ai-experiences-rapid-adoption-but-with-mixed-outcomes-highlights-from-vote-ai-machine-learning

McKinsey & Company, QuantumBlack. (2025). The state of AI: Global Survey 2025. https://www.mckinsey.com/capabilities/quantumblack/our-insights/the-state-of-ai

Frequently Asked Questions

How do I set up an AI data operations function?

Start by naming one accountable owner who can trace a model failure to a specific data problem and authorize the fix. Then separate the three layers, sourcing, annotation, and quality with feedback, set up tooling around dataset versioning and lineage, and automate only the parts that are reliable. The order matters because each step depends on the one before it.

What roles are in an AI data operations team?

The core roles are an accountable data operations lead, a data or DataOps engineer who builds the pipeline, an annotation and quality lead who owns guidelines and agreement targets, the annotation workforce, and the evaluation team that consumes the data and feeds findings back. The accountable owner is the role most often missing, and it should stay internal even when labeling is outsourced.

What tools support AI data operations?

You need four tool categories working together: orchestration, annotation and labeling platforms, observability and quality monitoring, and versioning with lineage. Lineage is the connective feature, because it lets you trace which dataset version fed which training run when something goes wrong.

What KPIs should I track for AI data operations?

Track a balanced set across quality, flow, and impact including inter-annotator agreement, annotation accuracy against a gold standard, edge-case and distribution coverage, dataset lineage completeness, cycle time and rework rate, and evaluation-to-remediation time. The last one matters most, because it shows whether your feedback loop from model behavior back to data work is actually closed.

How to Build an AI Data Operations Function: A Guided Framework Read Post »

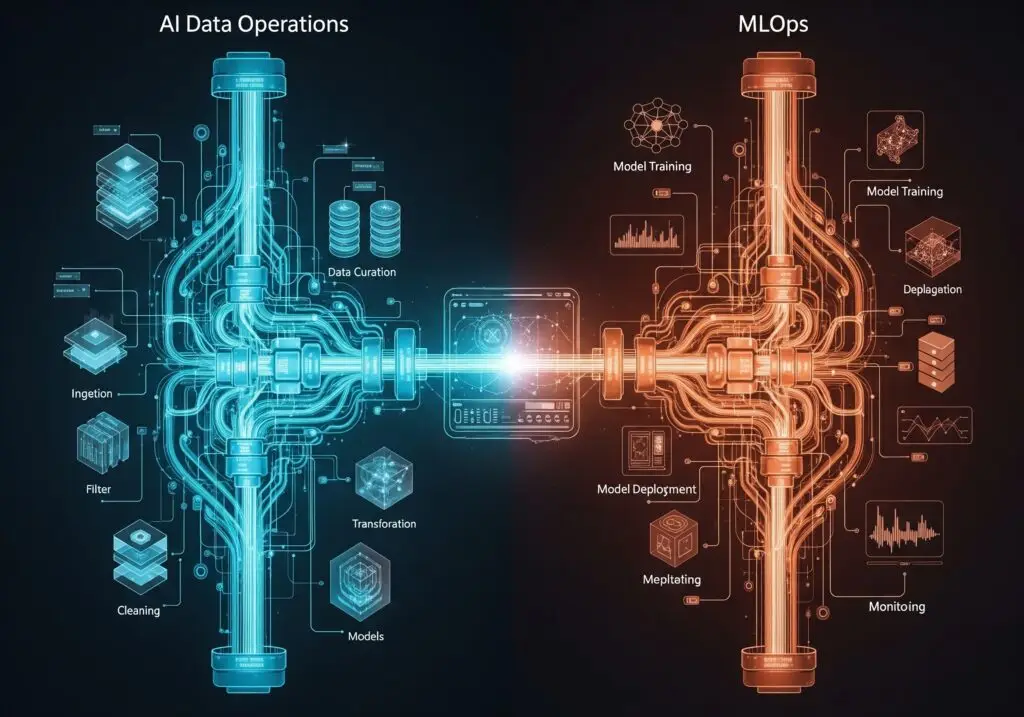
AI Data Operations vs. MLOps: Why Production AI Fails Without Both

AI Data Operations vs. MLOps: Key Differences, Use Cases, and Why Both Matter for Production AI

AI Data Operations is the discipline that produces and maintains the data an AI system learns from; collection, annotation, curation, human feedback, and the evaluation sets used to test it. MLOps is the discipline that trains, deploys, monitors, and retrains the models that consume that data. The two share roots in DevOps and meet at the pipeline, yet they own different assets and fail in different ways. A production AI program needs both, because a well-engineered model sitting on unreliable data still fails once it is live.

Teams usually learn the difference the hard way, when a model that passed every offline benchmark starts making strange calls in production. The cause is rarely the model code. It is almost always something upstream; a label definition that drifted, a data collection and curation process that quietly changed, or a data pipeline that started dropping a field with no warning. Treating these two functions as one job, or assuming one team owns both, is where many production AI programs lose months.

Key Takeaways

  • AI Data Operations is the work of building and maintaining the data a model learns from, while MLOps is the work of training, launching, and watching over the model itself.
  • The two are easy to confuse because they grew from the same playbook, but they look after different things and break in different ways.
  • A model can pass every test and still fail in real use if the data feeding it was messy or out of date.
  • The most common breakdowns happen at the handoff between the two teams, which is why a clear agreement on what “good data” means is so important.
  • If you have to choose where to fix things first, look at what fails more often: shaky data or shaky deployment.
  • Companies that treat data work as its own real job tend to ship more dependable AI than those who leave it as an afterthought.

What is AI Data Operations, and how is it different from classic DataOps?

AI Data Operations, sometimes called AI DataOps, is the operational discipline that turns raw signals into AI-ready datasets and keeps them reliable over time. It covers data collection, annotation, curation, human preference optimization, and the evaluation sets used to test models before and after release. Classic DataOps grew up in analytics and business intelligence, where the output is a dashboard or a report. AI Data Operations targets a different output: training and evaluation data whose quality directly changes how a model behaves.

A useful way to frame the scope comes from data-centric AI research, which organizes the work into three goals; training data development, inference data development, and data maintenance. Those goals map almost exactly onto what an AI data operations team does day to day. Building labeled training sets is training data development. Preparing prompts and retrieval context is inference data development. Re-labeling, auditing, and refreshing datasets as the world changes is data maintenance.

The hardest part of this discipline is rarely the labeling itself. It is the definition work of AI data operations that sits behind the labels. Two reasonable annotators will disagree on the same example whenever the guideline is vague, and that disagreement becomes noise the model learns as if it were signal. Measuring inter-annotator agreement, then tightening guidelines until agreement is high, is the unglamorous core of a serious data operation. Skip it, and every downstream metric inherits the ambiguity.

For most of the last decade, this work was treated as a side task for whoever happened to be free. That assumption no longer holds at production scale. Data engineering is becoming a core AI competency as models commoditize, and the data operation becomes the part of the stack that teams can actually differentiate on. Naming it as a discipline, with its own owners and standards, is the first step toward running it well.

What does MLOps actually own in the model lifecycle?

MLOps, short for machine learning operations, is the engineering discipline that moves models from a notebook into reliable production service. It borrows continuous integration, version control, and monitoring from DevOps and applies them to the model lifecycle. That lifecycle runs from experiment and training through validation, deployment, monitoring, and retraining. The asset MLOps protects is the model and its behavior in production.

MLOps assumes the training data already exists and is fit for purpose. It versions that data, tracks which dataset produced which model, and watches for drift once the model is live. What it does not do is produce the labels, resolve disagreement between annotators, or decide what a correct answer looks like. Those decisions sit upstream, in the data operation, and MLOps inherits whatever they produce.

This blind spot is well documented. A foundational paper offering a data quality-driven view of MLOps argued that most MLOps tooling concentrates on engineering concerns such as orchestration, reproducibility, and versioning, while doing little to monitor or version the datasets themselves. The gap is structural. When data quality is treated as someone else’s problem, it tends to surface later as a model incident that is expensive to trace.

Reproducibility is the other thing MLOps exists to guarantee. A model is only trustworthy in production if you can recreate exactly how it was built, roll back to a known-good version, and audit what changed between releases. That demands strict versioning of code, configuration, and the dataset reference, plus a registry that ties each deployed model to the run that produced it. None of this fixes a bad dataset. It only makes the consequences of one traceable, which is necessary but not sufficient on its own.

Where do AI Data Operations and MLOps overlap, and where do they diverge?

Both disciplines descend from DevOps, so they share a lot of mechanics. Both use version control, automated testing, continuous delivery, and monitoring. Both organize work into repeatable cycles instead of one-off projects. The overlap is real, and it is a large part of why the two are so often confused.

The divergence shows up in what each one owns and measures. AI Data Operations is judged on data quality distributed across inter-annotator agreement, label accuracy, coverage of edge cases, and freshness. MLOps is judged on model and system quality based on accuracy in production, latency, drift, and rollback safety. The table below maps the split across the dimensions that matter most when you decide who owns what.

Dimension AI Data Operations MLOps
Primary asset Training, annotation, and evaluation data Models and their behavior in production
Lifecycle Collect, annotate, curate, validate, maintain Experiment, train, validate, deploy, monitor, retrain
Core metrics Inter-annotator agreement, label accuracy, edge-case coverage, freshness Production accuracy, latency, drift, rollback safety
Typical owners Data ops leads, annotation managers, domain experts, QA ML engineers, platform and infrastructure teams, SREs
Example tooling Labeling platforms, consensus and QA tooling, dataset version control, curation pipelines Feature stores, model registries, CI/CD for models, serving and monitoring
Main failure mode Inconsistent labels, stale data, hidden bias Training and serving skew, undetected drift, fragile deployment

The shared vocabulary hides a subtle trap. Continuous integration means something different in each discipline. In MLOps, a pipeline run retrains and revalidates a model against a fixed dataset. In AI Data Operations, a pipeline run ingests new examples, routes them through annotation and QA, and publishes an updated dataset. Both are automated and both are tested, but a passing data pipeline and a passing model pipeline answer different questions. Confusing the two leads teams to trust a green build that never checked the thing that actually broke.

MLOps cannot hit its metrics if the data operation misses its own. A model registry with perfect lineage offers little comfort when the labels it points to were defined inconsistently across three annotation vendors.

Does MLOps include data operations?

This is the most common question, and the honest answer is partly. MLOps includes data handling; versioning datasets, building feature pipelines, and validating schemas at training time. It treats data as an input to be managed. It does not include the human and editorial work of producing that data, which means writing annotation guidelines, training annotators, adjudicating disagreement, and curating for coverage.

AI Data Operations and MLOps share the pipeline where data is prepared and fed to training. Upstream of that handoff, the data operation runs work that MLOps tooling was never designed to do. Downstream, MLOps runs work that no labeling platform handles. Calling one a subset of the other hides the seam where most production failures actually happen.

How does AI Data Operations feed the MLOps pipeline?

The connection point between the two is a handoff, and handoffs are where things break. The data operation produces a dataset, and MLOps consumes it for training and serving. When that boundary is informal, small upstream changes cause large downstream failures. A clear data contract, meaning an agreed schema, label taxonomy, and quality threshold, is what keeps the handoff stable.

Two failure patterns dominate this seam. The first is training and serving skew, where the transformation applied during training differs from the one applied at inference, so the model meets data it was never trained on. The second is silent schema drift, where a column changes type or a field stops arriving and nothing flags it. Data pipelines are important for AI as disciplined pipeline design prevents both, by making every transformation explicit and testable.

A data contract is what turns this from a hope into a guarantee. In practice it specifies the exact fields a dataset will contain, the label taxonomy and its allowed values, the minimum agreement and accuracy thresholds, and how changes are versioned and announced. With that contract in place, the data team can evolve its work and the model team can depend on a stable interface. Without it, every relabeling effort or new data source becomes a surprise that the MLOps team discovers through a failing model.

The feedback loop also runs the other way. Once a model is live, MLOps monitoring detects drift, which is a drop in accuracy as real-world inputs shift away from the training distribution and AI model performance degrades over time. That signal is only useful if the data operation can respond by sourcing and labeling fresh examples. 

What tools are used in AI data operations, and who owns them?

AI Data Operations runs on a different stack than MLOps. The core tools are labeling and annotation platforms, consensus and QA tooling for measuring agreement, dataset version control, and curation pipelines that filter and balance data. A 2024 survey of data quality tools for machine learning reviewed seventeen such tools and found the field still fragmented, with no single platform covering quality end to end. That fragmentation is why process and standards matter more than any one tool.

MLOps runs on feature stores, model registries, CI/CD systems built for models, and serving and monitoring platforms. The ownership split follows the tooling. Annotation managers, domain experts, and QA leads own the data operation. ML engineers, platform teams, and SREs own MLOps. Problems start when one group is held accountable for outcomes that the other group controls. A separate question is whether to run the data operation in-house at all, which the build vs. buy vs. partner decision for AI data operations works through for teams weighing their options.

Deciding where to invest first depends on what breaks more often:

  • If models pass offline tests but behave unpredictably in production, the bottleneck is usually data quality, and AI Data Operations needs attention first.
  • If models are sound but slow, fragile, or hard to deploy and roll back, the bottleneck is MLOps maturity.
  • If incidents cluster at the handoff, with schema mismatches, skew, and stale labels, the fix is a formal contract between the two, not more spending on either alone.

How Digital Divide Data Can Help

Digital Divide Data operates the data side of this split as a managed service. Our data collection and curation teams build training and evaluation datasets to an agreed taxonomy, with inter-annotator agreement tracked as a first-class metric rather than an afterthought. Domain experts and trained annotators handle the editorial decisions, including guideline design, disagreement adjudication, and edge-case coverage, that MLOps tooling cannot.

The work connects directly to the MLOps pipeline through disciplined delivery. Our model evaluation services produce the held-out and adversarial sets your team needs to validate models before release and to catch regressions after. When production monitoring flags drift, the same teams source and label fresh examples, which closes the loop between detection and response. This is the handoff that most programs leave informal, run instead as a contract with defined schemas and quality thresholds.

For programs that need the infrastructure as well as the labels, DDD builds and runs the data pipelines that move data from source to training-ready state, with quality checks at each stage. The result is an AI data operation that feeds MLOps cleanly, in place of a series of manual handoffs that fail quietly.

Build a data operation your MLOps pipeline can actually rely on. Talk to an operation and pipeline expert today.

Conclusion

AI Data Operations and MLOps are two halves of one production system. One keeps the data trustworthy, and the other keeps the model reliable. They share DevOps roots and meet at the pipeline, but they own different assets, use different tools, and fail in different ways. Treating them as a single job is how programs end up debugging model code to fix what was always a data problem.

The organizations that ship dependable AI treat the data operation as a named discipline with its own owners, metrics, and contract to the MLOps pipeline. The ones that struggle keep data work invisible, then absorb the cost downstream as drift, skew, and incidents no one can trace. As models commoditize, the gap between these two groups will widen, and it will be decided upstream, in the data operation, long before a model reaches production.

References

Zha, D., Bhat, Z. P., Lai, K.-H., Yang, F., Jiang, Z., Zhong, S., & Hu, X. (2025). Data-centric Artificial Intelligence: A Survey. ACM Computing Surveys, 57(5), 1–42. https://arxiv.org/abs/2303.10158

Zhou, Y., Tu, F., Sha, K., Ding, J., & Chen, H. (2024). A Survey on Data Quality Dimensions and Tools for Machine Learning. arXiv preprint arXiv:2406.19614. https://arxiv.org/abs/2406.19614

Renggli, C., Rimanic, L., Gürel, N. M., Karlaš, B., Wu, W., & Zhang, C. (2021). A Data Quality-Driven View of MLOps. IEEE Data Engineering Bulletin, 44(1), 11–23. https://arxiv.org/abs/2102.07750

Frequently Asked Questions

What is the difference between AI DataOps and MLOps?

AI Data Operations produces and maintains the data a model learns from, including collection, annotation, curation, and evaluation sets. MLOps trains, deploys, and monitors the model that uses that data. They overlap at the pipeline but own different assets.

Does MLOps include data operations?

Only partly. MLOps handles data as an input by versioning datasets, building feature pipelines, and validating schemas. It does not produce the labels or write the annotation guidelines, since that editorial work sits upstream in the data operation.

What tools are used in AI data operations?

Mainly labeling and annotation platforms, consensus and QA tooling for measuring agreement, dataset version control, and curation pipelines. The field is fragmented, so no single tool covers quality end to end, which is why standards and process matter as much as the tools.

Should we invest in AI Data Operations or MLOps first?

It depends on what breaks more often. If models pass offline tests but act up in production, fix data quality first. If models are sound but slow or fragile to deploy, invest in MLOps. If failures cluster at the handoff, formalize the contract between the two.

AI Data Operations vs. MLOps: Key Differences, Use Cases, and Why Both Matter for Production AI Read Post »

Data Annotation Provider Pricing Models Decoded: Per-Label, Per-Hour, or Outcome-Based?

Data Annotation Provider Pricing Models Decoded: Per-Label, Per-Hour, or Outcome-Based?

Most data annotation providers price work in one of three ways: per-label (a fixed rate per annotation unit), per-hour (time-and-materials for annotator time), or outcome-based (payment tied to a quality SLA such as accuracy or acceptance rate). Per-label rewards volume and fits high-volume, well-specified tasks; per-hour fits complex or evolving work where time per item is hard to predict; outcome-based aligns the provider with the quality your model actually needs. The cheapest headline rate is rarely the cheapest total cost, because rework, rejected batches, and re-labeling are billed somewhere downstream.

A quote that looks inexpensive per label can become the most expensive option once those hidden costs are counted. Pricing structure is not just a budget line; it sets the incentives that shape throughput, quality, and how much oversight your own team has to supply. That makes the structure behind a quote worth as much scrutiny as the number itself, especially for programs that depend on large-scale data collection and curation and on multimodal annotation spanning image, video, text, audio, and sensor data.

Key Takeaways

  • Data annotation providers usually charge in one of three ways; a set fee per label, an hourly rate for time worked, or a price tied to the quality they deliver.
  • Per-label pricing is easy to budget and works best for large, simple, repetitive jobs.
  • Hourly pricing fits complex or changing work where you can’t predict how long each item will take.
  • Outcome-based pricing costs more upfront but is the only model that pays for results instead of just effort.
  • The lowest quoted price is often the most expensive once you add in fixing and redoing poor-quality labels.
  • To compare vendors fairly, look at the cost per usable label, not the headline rate.

How do data annotation companies charge?

A data annotation provider or an annotation partner turns raw data into labeled training data for AI and ML systems. Its charges usually bundle some mix of annotation, quality assurance, tooling, project management, and, in mature engagements, downstream model evaluation that confirms the labels actually improve model behavior. Three pricing structures dominate the market: per-label (per-unit), per-hour (time-and-materials), and outcome- or SLA-based contracts. Each one moves risk between buyer and vendor in a different direction.

Published market guides put simple bounding-box labeling at roughly three to eight cents per object, with dense segmentation and 3D work costing far more, while hourly rates range from about four to sixty dollars depending on region and annotator skill. Those ranges are useful for sanity-checking a quote, but they do not tell you which structure protects you. The deeper question is which model ties what you pay to what you can actually use in training. Researchers studying high-stakes AI documented data cascades, downstream failures triggered by upstream data problems, and affecting 92% of the practitioners they surveyed, which is why pricing that quietly trades away quality rarely saves money.

What is per-label pricing, and when does it work?

Per-label pricing charges a fixed amount for each annotation unit: a bounding box, a polygon, a labeled entity, or a transcribed segment. It is the easiest model to forecast, because cost scales directly with volume, and it fits high-volume, well-specified, repetitive work where the time per item barely varies. Teams budgeting bounding box annotation cost for large image sets usually find that per-label is the most transparent option.

The structure rewards throughput, which is exactly its risk; when annotators are paid per unit, speed can quietly win over care, and ambiguous edge cases get the fastest defensible label rather than the correct one. Per-label also says nothing about quality on its own; unless your contract specifies payment on accepted units, you can pay for labels that later fail review. The economics shift further as hybrid human-and-AI labeling moves routine units to model pre-labeling and reserves people for correction, which lowers per-unit cost but concentrates the hard, judgment-heavy cases that per-label rates often underprice.

When is per-hour (time-and-materials) pricing the right model?

Per-hour pricing, also called time-and-materials, bills for the actual time annotators and reviewers spend. It suits complex or evolving works; detailed semantic segmentation, multi-step NLP, sensor-fusion labeling, etc., where time per item swings too much for a per-unit rate to be fair to either side. It is also the sensible choice early in a project, when the specification is still moving, and you do not yet know how long each item takes.

The trade-off is predictability; total cost is hard to forecast, and the model can reward slowness unless you track output. The protection is through, agree on expected units per hour from comparable past work, and review it regularly. Teams looking to speed up a data annotation project usually find the lever is workflow design and tooling, not simply paying for more hours, so per-hour contracts work best when paired with reported productivity targets.

How does outcome-based and SLA pricing change vendor incentives?

Outcome-based pricing ties payment to measurable results, usually an accuracy threshold, an accuracy threshold, an inter-annotator agreement target, an acceptance rate, or a turnaround SLA. It usually arrives as a managed service or project fee that bundles annotation, QA, tooling, and reporting. On a per-unit basis, it is often the most expensive structure, but it is the only one that aligns the provider’s incentive with the quality your model actually needs.

That alignment matters because label quality is not cosmetic. A study of ten widely used benchmark datasets found pervasive label errors averaging around 3.4%, and correcting them was enough to change which model ranked best. If a few percent of label noise can reorder model rankings, a pricing model that pays only for accepted, audited output is buying something a per-label discount cannot. Understanding what a figure like 99.5% accuracy means in production is what makes an outcome SLA enforceable rather than decorative.

What are the red flags in a data annotation pricing proposal?

A proposal’s structure reveals more than its rate. A few patterns consistently signal trouble, and most trace back to unreliable annotation that has to be fixed later:

  1. A headline rate with no acceptance definition: If the quote does not say what counts as an accepted label, rework is being priced as your problem, not the vendor’s.
  2. Quality assurance billed as an extra: QA, gold-standard audits, and review passes are part of producing usable data, not an upsell. Watch for setup, onboarding, and rework fees that surface only after signing.
  3. No throughput or quality baseline: Per-hour quotes without expected units per hour, and per-label quotes without a stated quality bar, leave you unable to predict either cost or outcome.
  4. Rush and change-order premiums left vague: Expedited work legitimately costs more, but undefined premiums of thirty to fifty percent can swamp the base rate.
  5. Lock-in disguised as low pricing: A cheap rate on a proprietary platform you cannot export from raises your switching cost later.

How to compare data annotation vendor quotes fairly?

The mistake in most comparisons is treating per-label, per-hour, and managed-service quotes as if they measure the same thing and deliver the same accuracy & quality, but they don’t. The only fair basis is cost per accepted, usable unit, i.e., the total fee divided by the labels that survive quality bar, rework included. A disciplined approach to evaluating AI training data providers should normalize every quote to that number before any rate is compared.

To compare quotes on equal footing:

  • Convert each quote to a blended cost per accepted unit using a shared sample task and identical acceptance criteria.
  • Ask for throughput and quality figures from comparable completed projects, not stated rates alone.
  • List every add-on: tooling, QA, project management, compliance, expedited delivery, and fold it into the unit cost.
  • Run a paid pilot on the same gold-standard set so each vendor is measured against the same ground truth.

How Digital Divide Data Can Help

Digital Divide Data structures pricing around the unit that matters to your model; accepted, audited output. Its data collection and curation services build quality gates, inter-annotator agreement tracking, and gold-standard auditing into the workflow rather than billing them as afterthoughts, so the number you compare is the number you can train on.

For teams weighing outcome-based contracts, DDD’s model evaluation services connect annotation quality to measured downstream behavior, which is what makes an accuracy or acceptance SLA enforceable. Engagements scale from per-unit work on well-specified tasks to managed delivery on complex multimodal and sensor data, with the pricing structure chosen to fit the program rather than the other way around.

Compare annotation quotes on what your model can actually use, not the headline rate. 

Conclusion

Pricing structure is a decision about incentives, not just budget. Per-label rewards volume, per-hour rewards time, and outcome-based rewards, the quality your model depends on; the right choice follows from how stable your specification is and whether you can measure quality at acceptance. Organizations that normalize every quote to cost per accepted unit consistently spend less over a program’s life than those anchored to the lowest headline rate, because they stop paying twice for the same labels.

The teams that get this right treat the contract as part of their quality system; the ones that do not tend to discover the true cost during a mid-project scramble. 

References

Sambasivan, N., Kapania, S., Highfill, H., Akrong, D., Paritosh, P., & Aroyo, L. (2021). “Everyone wants to do the model work, not the data work”: Data Cascades in High-Stakes AI. Proceedings of the 2021 CHI Conference on Human Factors in Computing Systems. https://doi.org/10.1145/3411764.3445518

Northcutt, C. G., Athalye, A., & Mueller, J. (2021). Pervasive Label Errors in Test Sets Destabilize Machine Learning Benchmarks. arXiv preprint arXiv:2103.14749. https://arxiv.org/abs/2103.14749

Frequently Asked Questions

How do data annotation companies charge?

Most use one of three structures: per-label (a set fee per annotation unit), per-hour (time-and-materials for annotator time), or outcome-based contracts tied to a quality SLA. The charge usually also folds in QA, tooling, and project management.

Is hourly or per-label annotation pricing better?

Neither is better in the abstract. Per-label fits high-volume, well-specified tasks where time per item barely varies, while per-hour fits complex or evolving work where you cannot predict how long each item takes. The deciding factor is how stable your specification is.

What should be in a data annotation pricing proposal?

A clear definition of what counts as an accepted label, QA and audit steps included rather than billed as extras, a throughput or quality baseline, and defined rush and change-order premiums. Missing any of these usually means rework is being priced as your problem.

How do I compare data annotation vendor quotes fairly?

Convert every quote to cost per accepted, usable unit using the same sample task and acceptance criteria, fold in all add-on fees, and run a paid pilot against an identical ground truth. Comparing headline rates alone hides where the real cost sits.

Data Annotation Provider Pricing Models Decoded: Per-Label, Per-Hour, or Outcome-Based? Read Post »

Data Annotation Provider vs. In-House Team: True Cost of Ownership Analysis

Data Annotation Provider vs. In-House Team: True Cost of Ownership Analysis

A side-by-side total cost of ownership analysis usually favors a data annotation provider for variable or specialized workloads. At the same time, a high-sensitivity program can justify the use of an in-house team. The deciding factor is rarely the headline price per label. It is the fully loaded cost: tooling, QA overhead, annotator ramp time, turnover, and the rework caused by inconsistent labels. Most teams underestimate these costs by a wide margin, which is why in-house budgets tend to overshoot, and outsourced programs win once quality and speed are priced in.

The number that matters is not what an annotator costs per hour. It is what an accepted, production-ready label costs after every revision cycle, supervisor hour, and idle seat is counted. Pricing a labeling program correctly means treating data collection and curation, and image and video annotation as operations with their own infrastructure, staffing, and failure modes. They are not a line item you can cover with spare headcount, and the data pipelines behind them carry standing costs whether or not any labeling is happening.

Key Takeaways

  • The real cost of labeling isn’t only the price per label; it’s everything around it: tools, quality checks, training time, staff turnover, idle time, and fixing mistakes.
  • Building an in-house team looks cheap on paper, but the hidden costs usually push the budget well past what businesses expect.
  • To find your true cost, divide your total spend by the labels that actually pass quality and get used, not the total number of labels that have been produced.
  • For most teams with changing or short-term needs, hiring a provider works out cheaper and faster than building a team from scratch.
  • An in-house team mainly pays off when you have steady, sensitive work that keeps everyone busy year-round, and the team has the capabilities to handle technically complex scenarios.
  • The smartest large companies often mix both, keeping sensitive work in-house while a partner handles the heavy lifting at scale.

What does the total cost of ownership mean for data annotation?

Total cost of ownership (TCO) is the full cost of producing usable labeled data over a program’s life. Many teams confuse TCO with unit price on a rate card. TCO includes direct labor, platform licensing, infrastructure, management, quality assurance, rework, and the opportunity cost of engineers pulled into data work. Where labels feed production systems, the cost of getting them wrong surfaces later in model evaluation and accuracy testing, which is why TCO has to count quality, not just throughput.

The reason TCO matters is that cheap labels are often expensive labels. Research on data cascades, the compounding downstream costs of undervalued data work, found that small early labeling problems tend to surface late as model failures and forced retraining. By then, the fix costs far more than careful labeling would have. Teams that budget only for annotator salaries consistently miss the second and third waves of cost.

What are the hidden costs of building an in-house annotation team?

Building internal capability looks cheap on a spreadsheet that contains only salaries. The costs that break budgets sit below that line. They are recurring, they scale with volume, and they are hard to forecast before the program is running. Five line items account for most of the overrun.

Tooling and infrastructure: Enterprise annotation platforms charge per seat or per label. Open-source tools are free to license but need highly skilled engineers to deploy, secure, and maintain them.

QA overhead: Someone has to write guidelines, audit samples, measure inter-annotator agreement, and adjudicate disagreements. This supervisory layer often runs 15 to 25 percent of labor.

Ramp time: New annotators take weeks to reach reliable accuracy on a non-trivial task. Output during ramp is real cost with a low usable yield.

Turnover: Repetitive labeling has high attrition. Every departure resets ramp time and erodes the institutional knowledge that keeps labels consistent.

Rework: Inconsistent labels get sent back for revision. Each cycle multiplies the effective cost of the affected items.

Outsourcing does not erase these costs. But it moves them onto a partner who amortizes tooling and QA across many clients. Choosing the wrong partner reintroduces them, and switching annotation providers mid-project adds re-onboarding, format conversion, and quality revalidation that can wipe out a season of savings. 

How do you calculate the true data annotation cost per label?

The honest unit cost is not the rate card. It is the fully loaded program cost divided by the number of labels that pass quality and reach production. Most teams divide by labels produced, which flatters the number. The denominator should be labeled.

True cost per label = (Labor + Tooling + Management + QA + Rework + Ramp/Idle) / Accepted labels

The gap between produced and accepted is where budgets quietly fail. A program that produces 100,000 labels but accepts 85,000 after QA has a true cost about 18 percent higher than its produced-label math suggests. Work on label errors and their effect on model performance shows that noisy labels measurably depress accuracy, so accepting weak labels to lower the headline rate only moves the bill downstream into retraining.

Market rates give a starting point, not an answer. Simple text classification often runs a few cents per label. Two-dimensional bounding boxes for images commonly range from roughly three to eight cents per object. Complex 3D point-cloud or medical segmentation can reach several dollars per item. The drivers of bounding box annotation cost, such as object density, occlusion, class count, and required accuracy, apply across almost every modality and explain most of the spread.

Is it cheaper to outsource data annotation or build in-house?

The answer depends on volume stability and on how honestly you account for hidden costs. In-house pushes cost into fixed overhead you pay whether or not work is flowing. A provider converts most of it into variable cost tied to output. A side-by-side makes the trade-off concrete.

Cost factor In-house team Data annotation provider
Cost structure Fixed, CAPEX-heavy; paid whether or not work flows Mostly variable, OPEX; tied to output
Tooling You buy or build, then maintain it Amortized across the provider’s clients
Ramp and turnover Your risk: each exit resets ramp time Absorbed by the partner
QA layer Your staff guidelines, audits, and adjudication Built into the service agreement
Scaling spikes Slow; bound by hiring speed Elastic; scale up or down on demand
Best fit Stable, long-term, security-sensitive volume Variable, specialized, or time-boxed work

For stable, multi-year, security-sensitive workloads with steady volume, an in-house team can reach a lower per-label cost once utilization stays high. For almost everything else, variable volume, new programs, specialized data types, or tight timelines, a provider tends to win on fully loaded cost. The break-even point moves with utilization, so the question is not which is cheaper but which keeps your seats full.

When should you choose a data annotation provider over an in-house team?

Organization size and annotation volume change the math more than any other variable. The same workload that justifies internal staff at one scale is a liability at another. Three patterns cover most cases.

  • Startups and new programs should outsource: You need to validate the approach before committing to fixed headcount, you may not need next quarter.
  • Mid-size teams with spiky volume should outsource the peaks and keep a small internal core for guidelines and QA. This caps fixed cost while preserving control of standards.
  • Large enterprises with steady, sensitive, multi-year volume usually do best with a hybrid model that splits the work by data sensitivity rather than by convenience.

The most durable arrangement is rarely all-or-nothing. Keeping schema design and the most sensitive data internal while a partner executes at scale is what the shift in enterprise labeling economics has made standard practice. It preserves control where control matters and buys elasticity everywhere else, which is exactly where in-house teams struggle most.

What is the ROI of professional data annotation services?

Return on investment shows up in three places, none of which appear on a rate card. Across a program, these gains often outweigh the unit-price difference entirely.

  • Time-to-market improves because trained teams deploy in weeks rather than months.
  • Rework falls, because mature QA catches errors before they reach training. 
  • Model performance per dollar rises because consistent labels reduce the retraining cycles that quietly consume engineering budgets. 

When data scientists spend their days on annotation triage, the opportunity cost is the model work they are not doing. A provider that delivers production-ready labels returns at that time, which is usually the most expensive resource in the whole program. Measured that way, professional services often pay for themselves before the first model ships.

How Digital Divide Data Can Help

DDD runs annotation as a managed operation, not a staffing arrangement. Across text, image, video, audio, and sensor data, multimodal data annotation services arrive with the tooling, trained workforce, and quality processes already in place. You absorb none of the ramp, turnover, or platform overhead that inflates in-house TCO, and the variable cost tracks your actual volume.

Quality is measured, not assumed. DDD tracks inter-annotator agreement, runs structured QA, and reports accepted-label yield, so the cost per production-ready label is visible rather than buried. For programs where label errors carry real downstream risk, that measurement is the difference between a low headline rate and a low true cost. It also makes the build-versus-buy comparison an honest one, because both sides are priced on accepted labels.

Whether you are validating a new program, absorbing a volume spike, or running a multi-year pipeline under a hybrid model, the engagement scales to your volume and your data sensitivity.

Run the real TCO numbers before you build or buy your next AI. Talk to an Expert

Conclusion

The cost of annotation is decided long before the first invoice. Teams that price only salaries build in-house, overshoot their budgets, and meet the hidden costs one at a time. Teams that price the fully loaded cost per accepted label make a clearer choice, and more often than not, it points toward a provider or a hybrid model.

The organizations that get this right treat labeling as an operation with measurable quality, because data quality defines the success of AI systems more than model architecture does. The ones that get it wrong keep paying for cheap labels in retraining cycles they never budgeted for. Either way, a program runs only as fast as its data, which is why teams increasingly invest in ways to speed up annotation throughput without trading away accuracy.

References

Sambasivan, N., Kapania, S., Highfill, H., Akrong, D., Paritosh, P., & Aroyo, L. M. (2021). “Everyone wants to do the model work, not the data work”: Data cascades in high-stakes AI. Proceedings of the 2021 CHI Conference on Human Factors in Computing Systems. https://doi.org/10.1145/3411764.3445518

Nahum, O., Calderon, N., Keller, O., Szpektor, I., & Reichart, R. (2024). Are LLMs better than reported? Detecting label errors and mitigating their effect on model performance. arXiv preprint arXiv:2410.18889. https://arxiv.org/abs/2410.18889

Frequently Asked Questions

Is it cheaper to outsource data annotation or do it in-house?

For variable or specialized workloads, it is usually cheaper to outsource once you count the hidden costs: tooling, QA, ramp time, and turnover. In-house tends to be cheaper only for stable, high-volume, long-running programs where the team stays fully utilized.

What are the hidden costs of data annotation?

The big ones are annotation tooling, the QA layer that writes guidelines and measures agreement, the weeks of ramp time before new annotators are reliable, turnover that resets that ramp, and the rework caused by inconsistent labels. None of these appear on a per-label rate card.

How do I calculate data annotation cost per label?

Add up labor, tooling, management, QA, rework, and ramp or idle time, then divide by the number of labels that actually pass quality and reach production, not the number produced. Accepted labels, not produced labels, give you the true unit cost.

When should I outsource data annotation?

Outsource when volume is variable, when you are validating a new program, when you need specialized data types or domain expertise, or when timelines are tight. Keep work in-house mainly for highly sensitive data with steady, long-term volume.

Data Annotation Provider vs. In-House Team: True Cost of Ownership Analysis Read Post »

AI Model Performance

Why AI Model Performance Degrades Over Time and What to Do About It

I’ve talked to a lot of enterprise teams that launched an AI program successfully and then watched it quietly get worse. Not a dramatic failure. Not a headline incident. Just a slow erosion: answer quality drops, user trust fades, adoption plateaus, and the team isn’t sure what changed. 

This pattern is exactly why leading firms now frame AI quality as an ongoing operating challenge: Deloitte notes that data integrity, model accuracy, data freshness, and uncontrolled model drift become more important as GenAI programs scale, while KPMG argues that AI risk management has to move from periodic reviews to continuous monitoring and drift detection.

What usually changes is the world around the model. The data it was trained on no longer reflects how people talk, what they ask about, or what the correct answer looks like. The model didn’t get worse. The gap between what it learned and what it faces in production got wider.

This is one of the most common and least discussed failure modes in enterprise AI. It’s not a launch problem. It’s a lifecycle problem. And it requires a different set of decisions than the ones that got the model deployed. Model evaluation services and data collection and curation services are the two capabilities that determine whether a program can catch and correct this drift before it becomes a business problem.

Key Takeaways

  • Model performance degradation is a lifecycle problem, not a launch problem. The model that performed well at deployment will drift from production reality over time without ongoing investment to close the gap.
  • Degradation is usually silent before it becomes visible. User trust and adoption erode before the technical metrics catch up. Programs without monitoring in place discover the problem late.
  • The root cause is almost always a data mismatch. Training data represents the world at a point in time. As production reality evolves, a static model stops reflecting it.
  • Retraining alone is not always the answer. If the problem is label quality, inconsistent annotation guidelines, or poor data selection, retraining on the same approach produces the same results.
  • The programs that maintain reliable model performance share one habit: they treat evaluation and data quality as ongoing operational disciplines, not one-time pre-launch activities.

Why Models Degrade: The Business View

The Gap Between Training and Production Widens Over Time

The production environment is not static. User behavior shifts, language evolves, business processes update, and market conditions change. The further a model gets from its training date, the more its learned patterns diverge from current reality.

In practice, this happens faster than most programs expect. A model tuned for one quarter’s customer behavior may already be showing degradation signals by the next. A GenAI system trained on one organizational knowledge base starts drifting as policies update, products change, and new content is created without making it into the retrieval index. The technical term is data drift or concept drift. The business translation is: the model is answering confidently from a map that no longer matches the territory.

Degradation Is Silent Until It Isn’t

The most damaging aspect of model degradation is how quietly it happens. There’s rarely a moment when the system produces one catastrophically wrong answer that triggers an investigation. Instead, outputs gradually become less precise, less relevant, or less aligned with what users actually need. Users stop trusting the system. Adoption plateaus. Teams report vague quality concerns that are hard to trace to a specific cause. By the time leadership recognizes there’s a problem, months of drift may have accumulated. Model evaluation services with continuous monitoring in place are the difference between catching drift early and discovering it after user trust has already eroded.

What Degradation Costs the Business

Degraded model performance has direct business costs that compound the longer they go unaddressed. Users who receive poor outputs from an AI system don’t only stop using that system. They form lasting opinions about the reliability of AI programs in the organization. Rebuilding that trust requires demonstrating consistently good performance over an extended period, which is a much harder problem than preventing the trust loss in the first place.

Consider a common pattern: a retail company deploys a pricing model that performs well through its first two quarters. Six months after launch, Q3 margins come in below forecast. The commercial team assumes a market shift. The data team assumes a modeling error. Neither team connects the gap to the fact that the model has never been retrained since launch, and the competitive and seasonal patterns it was trained on no longer reflect current conditions. By the time the root cause is identified, two quarters of margin impact have already been absorbed. The dollar value of that drift never appears on a dashboard that connects back to model quality, which is exactly why it persists.

The Most Common Causes of Degradation

Training Data That No Longer Reflects Production Reality

The most fundamental cause of model degradation is a mismatch between training data and production reality. As that gap widens, the model’s learned patterns become less applicable to the inputs it actually receives.

This mismatch can develop gradually, as language and behavior slowly shift, or suddenly, when a discrete change occurs. A product line update changes what users ask about. A regulatory change shifts how content should be classified. An economic event changes the patterns that a financial model was trained to detect. In each case, the model continues applying patterns that no longer map cleanly to reality, and performance degrades accordingly.

Fine-Tuning Without Monitoring

A less visible cause of degradation is fine-tuning operations that introduce new capabilities while silently reducing existing ones. Every fine-tuning run shifts the model’s behavior distribution. When that shift is not evaluated against the full scope of what the model is responsible for, it can inadvertently degrade performance in areas that weren’t the focus of the update. 

A model fine-tuned on new product documentation may handle new product queries better while handling existing product queries less accurately than before. Without a structured evaluation framework that covers the full deployment scope, the regression is invisible until users discover it. Model evaluation services that cover the full scope of deployment tasks, not just the capability being updated, are the only reliable way to detect this kind of silent regression.

Label Quality Drift in the Training Pipeline

A subtler but equally damaging cause of degradation is when the annotation practices that produced the original training data no longer match current guidelines. Over time, guideline interpretations drift between annotators. New annotators are onboarded with slightly different understandings of edge cases. Quality standards shift as programs scale. When new training data is produced under these drifted practices and used to retrain the model, the model learns from inconsistently labeled examples, and its performance reflects that inconsistency.

This cause is particularly hard to diagnose because the outputs look like model quality issues rather than data quality issues. The model seems confused about boundaries that it should understand clearly. The answer is often not a different model architecture. It’s recalibrating annotation guidelines, auditing recent training data for consistency, and retraining on reliably labeled examples.

When to Intervene and How

The Signals That Precede Measurable Degradation

By the time degradation shows up in aggregate performance metrics, it has usually been building for a while. The earlier signals are softer: user engagement with AI-generated outputs declining, escalation rates in AI-assisted workflows ticking up, and specific query categories showing lower satisfaction scores. These are the signals that a monitoring program needs to be watching before the technical metrics confirm what users already know.

Programs that catch degradation early share a common trait: they’ve built evaluation into the operational rhythm rather than treating it as a one-time activity. They run human evaluations on samples of production outputs on a defined cadence. They track performance metrics by query category, not just overall. They have a process for connecting user feedback signals to specific model behaviors rather than letting user complaints sit in a ticketing system disconnected from the data program.

Retraining Is Not Always the Right Response

When performance degradation is confirmed, the instinct is often to retrain the model on more recent data. Sometimes that’s the right response. But if the root cause is label quality drift, inconsistent annotation guidelines, or poor data selection rather than data currency, retraining on the same approach produces the same problems. The model gets updated, but the quality issues persist because the training data is still inconsistently labeled. Diagnosing the actual cause of degradation before committing to a retraining approach is the step that most programs skip, and most programs regret. Data collection and curation services that include data quality auditing alongside curation help programs understand whether their degradation problem is a data currency problem, a label quality problem, or a scope coverage problem, each of which has a different fix.

The Ongoing Data Investment That Prevents Degradation

The programs that maintain consistent model performance over time aren’t the ones that retrain more frequently. They’re the ones that maintain a continuous pipeline of high-quality training data that keeps pace with production reality. That means regular data collection from current production inputs, ongoing annotation that reflects current guidelines, and systematic coverage of the query types and scenarios where the model is most likely to encounter drift.

This is an operational commitment, not a project milestone. It requires the same infrastructure discipline that production software requires for maintenance: regular releases, regression testing, and a quality bar that doesn’t slip just because the system is already deployed.

Three Starter Steps 

If your program does not yet have structured monitoring and a data refresh cadence, three starting points deliver the most value with the least setup.

First, pick one metric to slice. Choose your most important output quality metric and start slicing it by input category rather than tracking it as a single aggregate number. If your model handles customer queries, break performance down by query type. If it classifies content, break it down by topic domain. This alone will surface localized degradation that top-line metrics hide.

Second, sample production outputs every two weeks. Pull a structured random sample of recent production outputs, fifty to one hundred examples, and have a human reviewer assess them against current quality standards. This does not need to be a full evaluation run. A lightweight spot check on a regular cadence will catch drift months before it shows up in aggregate metrics.

Third, assign ownership. Degradation persists partly because no one is accountable for catching it. Designate a specific person or team responsible for reviewing the spot-check results, owning the alert thresholds, and escalating when something looks off. Without a named owner, the cadence will lapse under pressure.

How Digital Divide Data Can Help

Digital Divide Data supports enterprise AI programs across the full model lifecycle, with particular depth in the evaluation and data quality work that prevents degradation from accumulating undetected. For programs building structured evaluation frameworks, model evaluation services design evaluation suites that cover the full scope of deployment tasks, establish performance baselines before any fine-tuning or updates, and run structured regression testing to catch silent degradation before users do. 

For programs identifying and addressing data quality issues, data collection and curation services include data quality auditing that distinguishes between data currency problems and label quality problems, so retraining efforts address the actual root cause. For programs building the ongoing annotation pipeline that model maintenance requires, data annotation solutions provide the continuous labeling infrastructure that keeps training data aligned with production reality as the environment evolves.

If your AI program doesn’t have structured monitoring and a data refresh cadence in place, that’s the right place to start. Talk to an expert.

Conclusion

Model degradation is a lifecycle problem that every enterprise AI program will encounter. The question isn’t whether the model will drift from the production environment. It’s whether the program is equipped to detect that drift early, diagnose its cause accurately, and respond with the right fix rather than the most available one.

The programs that handle this well share a common posture: they treat evaluation and data quality as ongoing operational disciplines rather than pre-launch activities. They’ve built monitoring into the production workflow, they audit annotation quality regularly, and they have a structured process for connecting user feedback to specific data gaps. That posture doesn’t eliminate model degradation. But it does ensure that when degradation starts, the program finds it first.

References

IBM. (2025). What is model drift? IBM Think. https://www.ibm.com/think/topics/model-drift

Bayram, F., Ahmed, B. S., & Kassler, A. (2022). From concept drift to model degradation: An overview on performance-aware drift detectors. Knowledge-Based Systems, 245, 108632. https://doi.org/10.1016/j.knosys.2022.108632

Sharma, P., Patwari, P., Buxo Ferrer, A., Kearns-Manolatos, D., Verma, A., & Alibage, A. (2025, February 6). Four data and model quality challenges tied to generative AI. Deloitte Insights. https://www.deloitte.com/us/en/insights/topics/digital-transformation/data-integrity-in-ai-engineering.html

KPMG. (2026). How AI is changing model risk management. https://kpmg.com/us/en/articles/2026/ai-model-risk.html

Frequently Asked Questions

Q1. How do you build the business case for ongoing model evaluation investment?

Frame it around the cost of late discovery, not the cost of monitoring. A monitoring program that catches degradation when it affects 5% of outputs is far cheaper than one that catches it after it has affected a quarter of revenue-generating decisions. The conversation gets easier when you can quantify what a two-quarter margin gap or a three-point drop in customer satisfaction would cost the business. Those are the numbers that create urgency. The monitoring investment is almost always small relative to the business impact of the failure it prevents.

Q2. Who should own model monitoring in an enterprise organization?

Monitoring works best when ownership is explicit and cross-functional. The data or ML team owns the technical instrumentation: the evaluation framework, the sampling cadence, and the alert thresholds. A business stakeholder owns the interpretation: connecting what the metrics say to what it means for the function the model supports. Both need to be in the loop, because technical metrics without business context produce alerts nobody acts on, and business feedback without technical routing produces complaints that never reach the people who can fix them.

Q3. Is retraining the model always the right response to performance degradation?

Not always. If the root cause is label quality drift, inconsistent annotation guidelines, or poor coverage of specific scenarios, retraining on the same approach produces the same problems. The model gets updated, but the quality issues persist because the training data is still inconsistently labeled. Diagnosing whether the problem is data currency, label quality, or coverage scope determines whether retraining is the right response, and what kind of retraining will actually fix it.

Q4. How often should AI models be retrained or updated?

There’s no universal cadence. The right frequency depends on how fast the production environment changes relative to what the model was trained on. Programs in fast-moving domains like customer behavior, fraud detection, or rapidly evolving product catalogs need more frequent updates than programs in stable domains. The right signal is the rate of drift detected through monitoring, not a fixed schedule. Programs that retrain on a fixed schedule, regardless of detected drift, either overtrain on domains where change is slow or undertrain on domains where change is fast.

Why AI Model Performance Degrades Over Time and What to Do About It Read Post »

Autonomous Systems Mobility

Video Annotation Services for Physical AI

Physical AI refers to intelligent systems that perceive, reason, and act within real environments. It includes autonomous vehicles, collaborative robots, drones, defense systems, embodied assistants, and increasingly, machines that learn from human demonstration. Unlike traditional software that processes static inputs, physical AI must interpret continuous streams of sensory data and translate them into safe, precise actions.

Video sits at the center of this transformation. Cameras capture motion, intent, spatial relationships, and environmental change. Over time, organizations have shifted from collecting isolated frames to gathering multi-camera, long-duration recordings. Video data may be abundant, but clean, structured, temporally consistent annotations are far harder to scale.

The backbone of reliable physical AI is not simply more data. It is well-annotated video data, structured in a way that mirrors how machines must interpret the world. High-quality video annotation services are not a peripheral function; they are foundational infrastructure.

This blog is a dive into how high-precision video annotation services enable Physical AI systems, from robotics to autonomous vehicles, to perceive, reason, and act safely in the real world.

What Makes Physical AI Different from Traditional Computer Vision?

Static Image AI vs. Temporal Physical AI

Traditional computer vision often focuses on individual frames. A model identifies objects within a snapshot. Performance is measured per image. While useful, this frame-based paradigm falls short when actions unfold over time.

Consider a warehouse robot picking up a package. The act of grasping is not one frame. It is a sequence: approach, align, contact, grip, lift, stabilize. Each phase carries context. If the grip slips, the failure may occur halfway through the lift, rather than at the moment of contact. A static frame does not capture intent or trajectory.

Temporal understanding demands segmentation of actions across sequences. It requires annotators to define start and end boundaries precisely. Was the grasp complete when the fingers closed or when the object left the surface? Small differences in labeling logic can alter how models learn.

Long-horizon task understanding adds another dimension. A five-minute cleaning task performed by a domestic robot contains dozens of micro-actions. The system must recognize not just objects but goals. A cluttered desk becomes organized through a chain of decisions. Labeling such sequences calls for more than object detection. It requires a structured interpretation of behavior.

The Shift to Embodied and Multi-Modal Learning

Vehicles combine camera feeds with LiDAR and radar. Robots integrate depth sensors and joint encoders. Wearable systems may include inertial measurement units.

This sensor fusion means annotations must align across modalities. A bounding box in RGB imagery might correspond to a three-dimensional cuboid in LiDAR space. Temporal synchronization becomes essential. A delay of even a few milliseconds could distort training signals.

Language integration complicates matters further. Many systems now learn from natural language instructions. A robot may be told, “Pick up the red mug next to the laptop and place it on the shelf.” For training, the video must be aligned with textual descriptions. The word “next to” implies spatial proximity. The action “place” requires temporal grounding.

Embodied learning also includes demonstration-based training. Human operators perform tasks while cameras record the process. The dataset is not just visual. It is a representation of skill. Capturing this skill accurately demands hierarchical labeling. A single demonstration may contain task-level intent, subtasks, and atomic actions.

Real-World Constraints

In lab conditions, the video appears clean. In real deployments, not so much. Motion blur during rapid turns, occlusions when objects overlap, glare from reflective surfaces, and shadows shifting throughout the day. Physical AI must operate despite these imperfections.

Safety-critical environments raise the stakes. An autonomous vehicle cannot misclassify a pedestrian partially hidden behind a parked van. A collaborative robot must detect a human hand entering its workspace instantly. Rare edge cases, which might appear only once in thousands of hours of footage, matter disproportionately.

These realities justify specialized annotation services. Labeling physical AI data is not simply about drawing shapes. It is about encoding time, intent, safety context, and multi-sensor coherence.

Why Video Annotation Is Critical for Physical AI

Action-Centric Labeling

Physical AI systems learn through patterns of action. Breaking down tasks into atomic components such as grasp, push, rotate, lift, and release allows models to generalize across scenarios. Temporal segmentation is central here. Annotators define the precise frame where an action begins and ends. If the “lift” phase is labeled inconsistently across demonstrations, models may struggle to predict stable motion.

Distinguishing aborted actions from completed ones helps systems learn to anticipate outcomes. Without consistent action-centric labeling, models may misinterpret motion sequences, leading to hesitation or overconfidence in deployment.

Object Tracking Across Frames

Tracking objects over time requires persistent identifiers. A pedestrian in frame one must remain the same entity in frame one hundred, even if partially occluded. Identity consistency is not trivial. In crowded scenes, similar objects overlap. Tracking errors can introduce identity switches that degrade training quality.

In warehouse robotics, tracking packages as they move along conveyors is essential for inventory accuracy. In autonomous driving, maintaining identity across intersections affects trajectory prediction. Annotation services must enforce rigorous tracking standards, often supported by validation workflows that detect drift.

Spatio-Temporal Segmentation

Pixel-level segmentation extended across time provides a granular understanding of dynamic environments. For manipulation robotics, segmenting the precise contour of an object informs grasp planning. For vehicles, segmenting drivable areas frame by frame supports safe navigation. Unlike single-frame segmentation, spatio-temporal segmentation must maintain shape continuity. Slight inconsistencies in object boundaries can propagate errors across sequences.

Multi-View and Egocentric Annotation

Many datasets now combine first-person and third-person perspectives. A wearable camera captures hand movements from the operator’s viewpoint while external cameras provide context. Synchronizing these views requires careful alignment. Annotators must ensure that action labels correspond across angles. A grasp visible in the egocentric view should align with object movement in the third-person view.

Human-robot interaction labeling introduces further complexity. Detecting gestures, proximity zones, and cooperative actions demands awareness of both participants.

Long-Horizon Demonstration Annotation

Physical tasks often extend beyond a few seconds. Cleaning a room, assembling a product, or navigating urban traffic can span minutes. Breaking down long sequences into hierarchical labels helps structure learning. At the top level, the task might be “assemble component.” Beneath it lie subtasks such as “align bracket” or “tighten screw.” At the lowest level are atomic actions.

Sequence-level metadata captures contextual factors such as environment type, lighting condition, or success outcome. This layered annotation enables models to reason across time rather than react to isolated frames.

Core Annotation Types Required for Physical AI Systems

Different applications demand distinct annotation strategies. Below are common types used in physical AI projects.

Bounding Boxes with Tracking IDs

Bounding boxes remain foundational, particularly for object detection and tracking. When paired with persistent tracking IDs, they enable models to follow entities across time. In autonomous vehicles, bounding boxes identify cars, pedestrians, cyclists, traffic signs, and more. In warehouse robotics, boxes track packages and pallets as they move between zones. Consistency in box placement and identity assignment is critical. Slight misalignment across frames may seem minor, but it can accumulate into trajectory prediction errors.

Polygon and Pixel-Level Segmentation

Segmentation provides fine-grained detail. Instead of enclosing an object in a rectangle, annotators outline its exact shape. Manipulation robots benefit from precise segmentation of tools and objects, especially when grasping irregular shapes. Safety-critical systems use segmentation to define boundaries of drivable surfaces or restricted zones. Extending segmentation across time ensures continuity and reduces flickering artifacts in training data.

Keypoint and Pose Estimation in 2D and 3D

Keypoint annotation identifies joints or landmarks on humans and objects. In human-robot collaboration, tracking hand, elbow, and shoulder positions helps predict motion intent. Three-dimensional pose estimation incorporates depth information. This becomes important when systems must assess reachability or collision risk. Pose labels must remain stable across frames. Small shifts in keypoint placement can introduce noise into motion models.

Action and Event Tagging in Time

Temporal tags mark when specific events occur. A vehicle stops at a crosswalk. A robot successfully inserts a component. A drone detects an anomaly.

Precise event boundaries matter. Early or late labeling skews training signals. For planning systems, recognizing event order is just as important as recognizing the events themselves.

Sensor Fusion Annotation

Physical AI increasingly relies on multi-sensor inputs. Annotators may synchronize camera footage with LiDAR point clouds, radar signals, or depth maps. Three-dimensional cuboids in LiDAR data complement two-dimensional boxes in video. Alignment across modalities ensures that spatial reasoning models learn accurate geometry.

Challenges in Video Annotation for Physical AI

Video annotation at this level is complex and often underestimated.

Temporal Consistency at Scale

Maintaining label continuity across thousands of frames is demanding. Drift can occur when object boundaries shift subtly. Correcting drift requires a systematic review. Automated checks can flag inconsistencies, but human oversight remains necessary. Even small temporal misalignments can affect long-horizon learning.

Long-Horizon Task Decomposition

Defining taxonomies for complex tasks requires domain expertise. Overly granular labels may overwhelm annotators. Labels that are too broad may obscure learning signals. Striking the right balance involves iteration. Teams often refine hierarchies as models evolve.

Edge Case Identification

Rare scenarios are often the most critical. A pedestrian darting into traffic. A tool slipped during assembly. Edge cases may represent a fraction of data but have outsized safety implications. Systematically identifying and annotating such cases requires targeted sampling strategies.

Multi-Camera and Multi-Sensor Alignment

Synchronizing multiple streams demands precise timestamp alignment. Small discrepancies can distort perception. Cross-modal validation helps ensure consistency between visual and spatial labels.

Annotation Cost Versus Quality Trade-Offs

Video annotation is resource-intensive. Frame sampling can reduce workload, but risks missing subtle transitions. Active learning loops, where models suggest uncertain frames for review, can improve efficiency. Still, cost and quality must be balanced thoughtfully.

Human in the Loop and AI-Assisted Annotation Pipelines

Purely manual annotation at scale is unsustainable. At the same time, fully automated labeling remains imperfect.

Foundation Model Assisted Pre-Labeling

Automated segmentation and tracking tools can generate initial labels. Annotators then correct and refine them. This approach accelerates throughput while preserving accuracy. It also allows teams to focus on complex cases rather than routine labeling.

Expert Review Layers

Tiered quality assurance systems add oversight. Initial annotators produce labels. Senior reviewers validate them. Domain specialists resolve ambiguous scenarios. In robotics projects, familiarity with task logic improves annotation reliability. Understanding how a robot moves or why a vehicle hesitates can inform labeling decisions.

Iterative Model Feedback Loops

Annotation is not a one-time process. Models trained on labeled data generate predictions. Errors are analyzed. Additional data is annotated to address weaknesses. This feedback loop gradually improves both the dataset and the model performance. It reflects an ongoing partnership between annotation teams and AI engineers.

How DDD Can Help

Digital Divide Data works closely with clients to define hierarchical action schemas that reflect real-world tasks. Instead of applying generic labels, teams align annotations with the intended deployment environment. For example, in a robotics assembly project, DDD may structure labels around specific subtask sequences relevant to that assembly line.

Multi-sensor support is integrated into workflows. Annotators are trained to align video frames with spatial data streams. Where AI-assisted tools are available, DDD incorporates them carefully, ensuring human review remains central. Quality assurance operates across multiple layers. Sampling strategies, inter-annotator agreement checks, and domain-focused reviews help maintain temporal consistency.

Conclusion

Physical AI systems do not learn from abstract ideas. They learn from labeled experience. Every grasp, every lane change, every coordinated movement between human and machine is encoded in annotated video. Model intelligence is bounded by annotation quality. Temporal reasoning, contextual awareness, and safety all depend on precise labels.

As organizations push toward more capable robots, smarter vehicles, and adaptable embodied agents, structured video annotation pipelines become strategic infrastructure. Those who invest thoughtfully in this foundation are likely to move faster and deploy more confidently.

The future of intelligent machines may feel futuristic. In practice, it rests on careful, detailed work done frame by frame.

Partner with Digital Divide Data to build high-precision video annotation pipelines that power reliable, real-world Physical AI systems.

References

Kawaharazuka, K., Oh, J., Yamada, J., Posner, I., & Zhu, Y. (2025). Vision-Language-Action Models for Robotics: A Review Towards Real-World Applications. IEEE Access, 13, 162467–162504. https://doi.org/10.1109/ACCESS.2025.3609980

Kou, L., Ni, F., Zheng, Y., Han, P., Liu, J., Cui, H., Liu, R., & Hao, J. (2025). RoboAnnotatorX: A comprehensive and universal annotation framework for accurate understanding of long-horizon robot demonstrations. In Proceedings of the IEEE/CVF International Conference on Computer Vision (ICCV) (pp. 10353–10363). https://openaccess.thecvf.com/content/ICCV2025/papers/Kou_RoboAnnotatorX_A_Comprehensive_and_Universal_Annotation_Framework_for_Accurate_Understanding_ICCV_2025_paper.pdf

VLA-Survey Contributors. (2025). Vision-Language-Action Models for Robotics: A Review Towards Real-World Applications [Project survey webpage]. https://vla-survey.github.io/

Frequently Asked Questions

How much video data is typically required to train a Physical AI system?
Requirements vary by application. A warehouse manipulation system might rely on thousands of demonstrations, while an autonomous driving stack may require millions of frames across diverse environments. Data diversity often matters more than sheer volume.

How long does it take to annotate one hour of complex robotic demonstration footage?
Depending on annotation depth, one hour of footage can take several hours or even days to label accurately. Temporal segmentation and hierarchical labeling significantly increase effort compared to simple bounding boxes.

Can synthetic data reduce video annotation needs?
Synthetic data can supplement real-world footage, especially for rare scenarios. However, models deployed in physical environments typically benefit from real-world annotated sequences to capture unpredictable variation.

What metrics indicate high-quality video annotation?
Inter-annotator agreement, temporal boundary accuracy, identity consistency in tracking, and cross-modal alignment checks are strong indicators of quality.

How often should annotation taxonomies be updated?
As models evolve and deployment conditions change, taxonomies may require refinement. Periodic review aligned with model performance metrics helps ensure continued relevance.


Video Annotation Services for Physical AI Read Post »

Data Pipelines

Scaling Finance and Accounting with Intelligent Data Pipelines

Finance teams often operate across multiple ERPs, dozens of SaaS tools, regional accounting systems, and an endless stream of spreadsheets. Even in companies that have invested heavily in automation, the automation tends to focus on discrete tasks. A bot posts journal entries. An OCR tool extracts invoice data. A workflow tool routes approvals.

Traditional automation and isolated ERP upgrades solve tasks. They do not address systemic data challenges. They do not unify the flow of information from source to insight. They do not embed intelligence into the foundation.

Intelligent data pipelines are the foundation for scalable, AI-enabled, audit-ready finance operations. This guide will explore how to scale finance and accounting with intelligent data pipelines, discuss best practices, and design a detailed pipeline.

What Are Intelligent Data Pipelines in Finance?

Data moves on a schedule, not in response to events. They are rule-driven, with transformation logic hard-coded by developers who may no longer be on the team. A minor schema change in a source system can break downstream reports. Observability is limited. When numbers look wrong, someone manually traces them back through layers of SQL queries.

Reconciliation loops often sit outside the pipeline entirely. Spreadsheets are exported. Variances are investigated offline. Adjustments are manually entered. This architecture may function, but it does not scale gracefully.

Intelligent pipelines operate differently. They are event-driven and capable of near real-time processing when needed. If a large transaction posts in a subledger, the pipeline can trigger validation logic immediately. AI-assisted validation and classification can flag anomalies before they accumulate. The system monitors itself, surfacing data quality issues proactively instead of waiting for someone to notice a discrepancy in a dashboard.

Lineage and audit trails are built in, not bolted on. Every transformation is traceable. Every data version is preserved. When regulators or auditors ask how a number was derived, the answer is not buried in a chain of emails.

These pipelines also adapt. As new data sources are introduced, whether a billing platform in the US or an e-invoicing portal in Europe, integration does not require a complete redesign. Regulatory changes can be encoded as logic updates rather than emergency workarounds.

Intelligence in this context is not a marketing term. It refers to systems that can detect patterns, surface outliers, and adjust workflows in response to evolving conditions.

Core Components of an Intelligent F&A Pipeline

Building this capability requires more than a data warehouse. It involves multiple layers working together.

Unified Data Ingestion

The starting point is ingestion. Financial data flows from ERP systems, sub-ledgers, banks, SaaS billing platforms, procurement tools, payroll systems, and, increasingly, e-invoicing portals mandated by governments. Each source has its own schema, frequency, and quirks.

An intelligent pipeline connects to these sources through API first connectors where possible. It supports both structured and unstructured inputs. Bank statements, PDF invoices, XML tax filings, and system logs all enter the ecosystem in a controlled way. Instead of exporting CSV files manually, the flow becomes continuous.

Data Standardization and Enrichment

Raw data is rarely analysis-ready, and the chart of accounts mapping across entities must be harmonized. Currencies require normalization with appropriate exchange rate logic. Tax rules need to be embedded according to jurisdiction. Metadata tagging helps identify transaction types, risk categories, or business units. Standardization is where many initiatives stall. It can feel tedious. Yet without consistent data models, higher-level intelligence has nothing stable to stand on.

Automated Validation and Controls

This is where the pipeline starts to show its value. Duplicate detection routines prevent double-posting. Outlier detection models surface transactions that fall outside expected ranges. Policy rule enforcement ensures segregation of duties and that approval thresholds are respected. When something fails validation, exception routing directs the issue to the appropriate owner. Instead of discovering errors at month, teams address them as they occur.

Reconciliation and Matching Intelligence

Reconciliation is often one of the most labor-intensive parts of finance operations. Intelligent pipelines can automate invoice-to-purchase-order matching, applying flexible logic rather than rigid thresholds. Intercompany elimination logic can be encoded systematically. Cash application can be auto-matched based on patterns in remittance data.

Accrual suggestion engines may propose entries based on historical behavior and current trends, subject to human review. The goal is not to remove accountants from the process, but to reduce repetitive work that adds little judgment.

Observability and Governance Layer

Finance cannot compromise on control. Data lineage tracking shows how each figure was constructed. Version control ensures that changes in logic are documented. Access management restricts who can view or modify sensitive data. Continuous control monitoring provides visibility into compliance health. Without this layer, automation introduces risk. With it, automation can enhance control.

AI Ready Data Outputs

Once data flows are clean, validated, and governed, advanced use cases become realistic. Forecast models draw from consistent historical and operational data. Risk scoring engines assess exposure based on transaction patterns. Scenario simulations evaluate the impact of pricing changes or currency shifts. Some organizations experiment with narrative generation for close commentary, where systems draft variance explanations for review. That may sound futuristic, but with reliable inputs, it becomes practical.

Why Finance and Accounting Cannot Scale Without Pipeline Modernization

Scaling finance is not simply about handling more transactions. It involves complexity across entities, products, regulations, and stakeholder expectations. Without pipeline modernization, each layer of complexity multiplies manual effort.

The Close Bottleneck

Real-time subledger synchronization ensures that transactions flow into the general ledger environment without delay. Pre-close anomaly detection identifies unusual movements before they distort financial statements. Continuous reconciliation reduces the volume of open items at period end. Close orchestration tools integrated into the pipeline can track task completion, flag bottlenecks, and surface risk areas early. Instead of compressing all effort into the last few days of the month, work is distributed more evenly. This does not eliminate judgment or oversight. It redistributes effort toward analysis rather than firefighting.

Accounts Payable and Receivable Complexity

Accounts payable teams increasingly manage invoices in multiple formats. PDF attachments, EDI feeds, XML submissions, and portal-based invoices coexist. In Europe, e-invoicing mandates introduce standardized but still varied requirements across countries. Cross-border transactions require careful tax handling. Exception rates can be high, especially when purchase orders and invoices do not align cleanly. Accounts receivable presents its own challenges. Remittance information may be incomplete. Customers pay multiple invoices in a single transfer. Currency differences create reconciliation headaches.

Pipeline-driven transformation begins with intelligent document ingestion. Optical character recognition, combined with classification models, extracts key fields. Coding suggestions align invoices with the appropriate accounts and cost centers. Automated two-way and three-way matching reduces manual review.

Predictive exception management goes further. By analyzing historical mismatches, the system may anticipate likely issues and flag them proactively. If a particular supplier frequently submits invoices with missing tax identifiers, the pipeline can route those invoices to a specialized queue immediately. On the receivables side, pattern-based cash application improves matching accuracy. Instead of relying solely on exact invoice numbers, the system considers payment behavior patterns.

Multi-Entity and Global Compliance Pressure

Organizations operating across the US and Europe must navigate differences between IFRS and GAAP. Regional VAT regimes vary significantly. Audit traceability requirements are stringent. Data privacy obligations affect how financial information is stored and processed. Managing this complexity manually is unsustainable at scale.

Intelligent pipelines enable structured compliance logic. Jurisdiction-aware validation rules apply based on entity or transaction attributes. VAT calculations can be embedded with country-specific requirements. Reporting formats adapt to regulatory expectations. Complete audit trails reduce the risk of undocumented adjustments. Controlled AI usage, with clear logging and oversight, supports explainability. It would be naive to suggest that pipelines eliminate regulatory risk. Regulations evolve, and interpretations shift. Yet a flexible, governed data architecture makes adaptation more manageable.

Moving from Periodic to Continuous Finance

From Month-End Event to Always-On Process

Ongoing reconciliations ensure that balances stay aligned. Embedded accrual logic captures expected expenses in near real time. Real-time variance detection flags deviations early. Automated narrative summaries may draft initial commentary on significant movements, providing a starting point for review. Instead of writing explanations from scratch under a deadline, finance professionals refine system-generated insights.

AI in the Close Cycle

AI applications in close are expanding cautiously. Variance explanation generation can analyze historical trends and operational drivers to propose plausible reasons for changes. Journal entry recommendations based on recurring patterns can save time. Control breach detection models identify unusual combinations of approvals or postings. Risk scoring for high-impact accounts helps prioritize review. Not every balance sheet account requires the same level of scrutiny each period.

Still, AI is only as strong as the pipeline feeding it. If source data is inconsistent or incomplete, outputs will reflect those weaknesses. Blind trust in algorithmic suggestions is dangerous. Human oversight remains essential.

Designing a Scalable Finance Intelligent Data Pipeline

Ambition without architecture leads to frustration. Designing a scalable pipeline requires a clear blueprint.

Source Layer

The source layer includes ERP systems, CRM platforms, billing engines, banking APIs, procurement tools, payroll systems, and any other financial data origin. Each source should be cataloged with defined ownership and data contracts.

Ingestion Layer

Ingestion relies on API first connectors where available. Event streaming may be appropriate for high-volume or time-sensitive transactions. The pipeline must accommodate both structured and unstructured ingestion. Error handling mechanisms should be explicit, not implicit.

Processing and Intelligence Layer

Here, data transformation logic standardizes schemas and applies business rules. Machine learning models handle classification and anomaly detection. A policy engine enforces approval thresholds, segregation of duties, and compliance logic. Versioning of transformations is critical. When a rule changes, historical data should remain traceable.

Control and Governance Layer

Role-based access restricts sensitive data. Audit logs capture every significant action. Model monitoring tracks performance and drift. Data quality dashboards provide visibility into completeness, accuracy, and timeliness. Governance is not glamorous work, but without it, scaling introduces risk.

Consumption Layer

Finally, data flows into BI tools, forecasting systems, regulatory reporting modules, and executive dashboards. Ideally, these outputs draw from a single governed source of truth rather than parallel extracts. When each layer is clearly defined, teams can iterate without destabilizing the entire system.

Why Choose DDD?

Digital Divide Data combines technical precision with operational discipline. Intelligent finance pipelines depend on clean, structured, and consistently validated data, yet many organizations underestimate how much effort that actually requires. DDD focuses on the groundwork that determines whether automation succeeds or stalls. From large-scale document digitization and structured data extraction to annotation workflows that train classification and anomaly detection models, DDD approaches data as a long-term asset rather than a one-time input. The teams are trained to follow defined quality frameworks, apply rigorous validation standards, and maintain traceability across datasets, which is critical in finance environments where errors are not just inconvenient but consequential.

DDD supports evolution with flexible delivery models and experienced talent who understand structured financial data, compliance sensitivity, and process documentation. Instead of treating data preparation as an afterthought, DDD embeds governance, audit readiness, and continuous quality monitoring into the workflow. The result is not just faster data processing, but greater confidence in the systems that depend on that data.

Conclusion

Finance transformation often starts with tools. A new ERP module, a dashboard upgrade, a workflow platform. Those investments matter, but they only go so far if the underlying data continues to move through disconnected paths, manual reconciliations, and fragile integrations. Scaling finance is less about adding more technology and more about rethinking how financial data flows from source to decision.

Intelligent data pipelines shift the focus to that foundation. They connect systems in a structured way, embed validation and controls directly into the flow of transactions, and create traceable, audit-ready outputs by design. Over time, this reduces operational friction. Closed cycles become more predictable. Exception handling becomes more targeted. Forecasting improves because the inputs are consistent and timely.

Scaling finance and accounting is not about working harder at month-end. It is about building an infrastructure where data flows cleanly, controls are embedded, intelligence is continuous, compliance is systematic, and insights are available when they are needed. Intelligent data pipelines make that possible.

Partner with Digital Divide Data to build the structured, high-quality data foundation your intelligent finance pipelines depend on.

References

Deloitte. (2024). Automating finance operations: How generative AI and people transform the financial close. https://www.deloitte.com/us/en/services/audit-assurance/blogs/accounting-finance/automating-finance-operations.html

KPMG. (2024). From digital close to intelligent close. https://kpmg.com/us/en/articles/2024/finance-digital-close-to-intelligent-close.html

PwC. (2024). Transforming accounts payable through automation and AI. https://www.pwc.com/gx/en/news-room/assets/analyst-citations/idc-spotlight-transforming-accounts-payable.pdf

European Central Bank. (2024). Artificial intelligence: A central bank’s view. https://www.ecb.europa.eu/press/key/date/2024/html/ecb.sp240704_1~e348c05894.en.html

International Monetary Fund. (2025). AI projects in financial supervisory authorities: Toolkit and governance considerations. https://www.imf.org/-/media/files/publications/wp/2025/english/wpiea2025199-source-pdf.pdf

FAQs

1. How long does it typically take to implement an intelligent finance data pipeline?

Timelines vary widely based on system complexity and data quality. A focused pilot in one function, such as accounts payable, may take three to six months. A full enterprise rollout across multiple entities can extend over a year. The condition of existing data and clarity of governance structures often determine speed more than technology selection.

2. Do intelligent data pipelines require replacing existing ERP systems?

Not necessarily. Many organizations layer intelligent pipelines on top of existing ERPs through API integrations. The goal is to enhance data flow and control without disrupting core transaction systems. ERP replacement may be considered separately if systems are outdated, but it is not a prerequisite.

3. How do intelligent pipelines handle data privacy in cross-border environments?

Privacy requirements can be encoded into access controls, data masking rules, and jurisdiction-specific storage policies within the governance layer. Role-based permissions and audit logs help ensure that sensitive financial data is accessed appropriately and in compliance with regional regulations.

4. What skills are required within the finance team to manage intelligent pipelines?

Finance teams benefit from professionals who understand both accounting principles and data concepts. This does not mean every accountant must become a data engineer. However, literacy in data flows, controls, and basic analytics becomes increasingly valuable. Collaboration between finance, IT, and data teams is essential.

5. Can smaller organizations benefit from intelligent pipelines, or is this only for large enterprises?

While complexity increases with size, smaller organizations also face fragmented tools and growing compliance expectations. Scaled-down versions of intelligent pipelines can still reduce manual effort and improve control. The architecture may be simpler, but the principles remain relevant.

Scaling Finance and Accounting with Intelligent Data Pipelines Read Post »

Structure And Enrich Data

How to Structure and Enrich Data for AI-Ready Content

Raw documents, PDFs, spreadsheets, and legacy databases were never designed with generative systems in mind. They store information, but they do not explain it. They contain facts, but little structure around meaning, relevance, or relationships. When these assets are fed directly into modern AI systems, the results can feel unpredictable at best and misleading at worst.

Unstructured and poorly described data slow down every downstream initiative. Teams spend time reprocessing content that already exists. Engineers build workarounds for missing context. Subject matter experts are pulled into repeated validation cycles. Over time, these inefficiencies compound.

This is where the concept of AI-ready content becomes significant. In an environment shaped by generative AI, retrieval-augmented generation, knowledge graphs, and even early autonomous agents, content must be structured, enriched, and governed with intention. 

This blog examines how to structure and enrich data for AI-ready content, as well as how organizations can develop pipelines that support real-world applications rather than fragile prototypes.

What Does AI-Ready Content Actually Mean?

AI-ready content is often described vaguely, which does not help teams tasked with building it. In practical terms, it refers to content that can be reliably understood, retrieved, and reasoned over by AI systems without constant manual intervention. Several characteristics tend to show up consistently.

First, the content is structured or at least semi-structured. This does not imply that everything lives in rigid tables, but it does mean that documents, records, and entities follow consistent patterns. Headings mean something. Fields are predictable. Relationships are explicit rather than implied.

Second, the content is semantically enriched. Important concepts are labeled. Entities are identified. Terminology is normalized so that the same idea is not represented five different ways across systems.

Third, context is preserved. Information is rarely absolute. It depends on time, location, source, and confidence. AI-ready content carries those signals forward instead of stripping them away during processing.

Fourth, the content is discoverable and interoperable. It can be searched, filtered, and reused across systems without bespoke transformations every time.

Finally, it is governed and traceable. There is clarity around where data came from, how it has changed, and how it is allowed to be used.

It helps to contrast this with earlier stages of content maturity. Digitized content simply exists in digital form. A scanned PDF meets this bar, even if it is difficult to search. Searchable content goes a step further by allowing keyword lookup, but it still treats text as flat strings. AI-ready content is different. It is designed to support reasoning, not just retrieval.

Without structure and enrichment, AI systems tend to fail in predictable ways. They retrieve irrelevant fragments, miss critical details, or generate confident answers that subtly distort the original meaning. These failures are not random. They are symptoms of content that lacks the signals AI systems rely on to behave responsibly.

Structuring Data: Creating a Foundation AI Can Reason With

Structuring data is often misunderstood as a one-time formatting exercise. In reality, it is an ongoing design decision about how information should be organized so that machines can work with it meaningfully.

Document and Content Decomposition

Large documents rarely serve AI systems well in their original form. Breaking them into smaller units is necessary, but how this is done matters. Arbitrary chunking based on character count or token limits may satisfy technical constraints, yet it often fractures meaning.

Semantic chunking takes a different approach. It aligns chunks with logical sections, topics, or arguments. Headings and subheadings are preserved. Tables and figures remain associated with the text that explains them. References are not detached from the claims they support.

This approach allows AI systems to retrieve information that is not only relevant but also coherent. It may take more effort upfront, but the reduction in downstream errors is noticeable.

Schema and Data Models

Structure also requires shared schemas. Documents, records, entities, and events should follow consistent models, even when sourced from different systems. This does not mean forcing everything into a single rigid format. It does mean agreeing on what fields exist, what they represent, and how they relate.

Mapping unstructured content into structured fields is often iterative. Early versions may feel incomplete. That is acceptable. Over time, as usage patterns emerge, schemas can evolve. What matters is that there is alignment across teams. When one system treats an entity as a free-text field, and another treats it as a controlled identifier, integration becomes fragile.

Linking and Relationships

Perhaps the most transformative aspect of structuring is moving beyond flat representations. Information gains value when relationships are explicit. Concepts relate to other concepts. Documents reference other documents. Versions supersede earlier ones.

Capturing these links enables cross-document reasoning. An AI system can trace how a requirement evolved, identify dependencies, or surface related guidance that would otherwise remain hidden. This relational layer often determines whether AI feels insightful or superficial.

Enriching Data: Adding Meaning, Context, and Intelligence

If structure provides the skeleton, enrichment provides the substance. It adds meaning that machines cannot reliably infer on their own.

Metadata Enrichment

Metadata comes in several forms. Descriptive metadata explains what the content is about. Structural metadata explains how it is organized. Semantic metadata captures meaning. Operational metadata tracks usage, ownership, and lifecycle.

Quality matters here. Sparse or inaccurate metadata misleads AI systems just as much as missing metadata. Automated enrichment can help at scale, but it should be guided by clear definitions. Otherwise, inconsistency simply spreads faster.

Semantic Annotation and Labeling

Semantic annotation goes beyond basic metadata. It identifies entities, concepts, and intent within content. This is particularly important in domains with specialized language. Acronyms, abbreviations, and jargon need normalization.

When done well, annotation allows AI systems to reason at a conceptual level rather than relying on surface text. It also supports reuse across content silos. A concept identified in one dataset becomes discoverable in another.

Contextual Signals

Context is often overlooked because it feels subjective. Yet temporal relevance, geographic scope, confidence levels, and source authority all shape how information should be interpreted. A guideline from ten years ago may still be valid, or it may not. A regional policy may not apply globally.

Capturing these signals reduces hallucinations and improves trust. It allows AI systems to qualify their responses rather than presenting all information as equally applicable.

Structuring and Enrichment for RAG and Generative AI

Retrieval-augmented generation depends heavily on content quality. Chunk quality determines what can be retrieved. Metadata richness influences ranking and filtering. Relationship awareness allows systems to pull in supporting context.

When content is well structured and enriched, retrieval becomes more precise. Answers become more complete because related information is surfaced together. Explainability improves because the system can reference coherent sources rather than disconnected fragments.

Designing content pipelines specifically for generative workflows requires thinking beyond storage. It requires anticipating how information will be queried, combined, and presented. This is often where early projects stumble. They adapt legacy content pipelines instead of rethinking them.

Knowledge Graphs as an Enrichment Layer

Vector search works well for similarity-based retrieval, but it has limits. As questions become more complex, relying solely on similarity may not suffice. This is where knowledge graphs become relevant.

Knowledge graphs represent entities, relationships, and hierarchies explicitly. They support multi-hop reasoning. They make implicit knowledge explicit. For domains with complex dependencies, this can be transformative.

Integrating structured content with graph representations allows systems to combine statistical similarity with logical structure. The result is often a more grounded and controllable AI experience.

Building an AI-Ready Content Pipeline

End-to-End Workflow

An effective pipeline typically begins with ingestion. Content arrives in many forms, from scanned documents to databases. Parsing and structuring follow, transforming raw inputs into usable representations. Enrichment and annotation add meaning. Validation and quality checks ensure consistency. Indexing and retrieval make the content accessible to downstream systems.

Each stage builds on the previous one. Skipping steps rarely saves time in the long run.

Human-in-the-Loop Design

Automation is essential at scale, but human expertise remains critical. Expert review is most valuable where ambiguity is highest. Feedback loops allow systems to improve over time. Measuring enrichment quality helps teams prioritize effort. This balance is not static. As systems mature, the role of humans shifts from correction to oversight.

Measuring Success: How to Know Your Data Is AI-Ready

Determining whether data is truly AI-ready is rarely a one-time assessment. It is an ongoing process that combines technical signals with real-world business outcomes. Metrics matter, but they need to be interpreted thoughtfully. A system can appear to work while quietly producing brittle or misleading results.

Some of the most useful indicators tend to fall into two broad categories: data quality signals and operational impact.

Key quality metrics to monitor include:

  • Retrieval accuracy, which reflects how often the system surfaces the right content for a given query, not just something that looks similar at a surface level. High accuracy usually points to effective chunking, metadata, and semantic alignment.
  • Coverage, which measures how much relevant content is actually retrievable. Gaps often reveal missing annotations, inconsistent schemas, or content that was never properly decomposed.
  • Consistency, especially across similar queries or use cases. If answers vary widely when the underlying information has not changed, it may suggest weak structure or conflicting enrichment.
  • Explainability, or the system’s ability to clearly reference where information came from and why it was selected. Poor explainability often signals insufficient context or missing relationships between content elements.

Common business impact signals include:

  • Reduced hallucinations, observed as fewer incorrect or fabricated responses during user testing or production use. While hallucinations may never disappear entirely, a noticeable decline usually reflects better data grounding.
  • Faster insight generation, where users spend less time refining queries, cross-checking answers, or manually searching through source documents.
  • Improved user trust, often visible through increased adoption, fewer escalations to subject matter experts, or a growing willingness to rely on AI-assisted outputs for decision support.
  • Lower operational friction, such as reduced reprocessing of content or fewer ad hoc fixes in downstream AI workflows.

Evaluation should be continuous rather than episodic. Content changes, regulations evolve, and organizational language shifts over time. Pipelines that remain static tend to degrade quietly, even if models are periodically updated. Regular audits, feedback loops, and targeted reviews help ensure that data remains structured, enriched, and aligned with how AI systems are actually being used.

Conclusion

Organizations that treat content as a machine-intelligent asset tend to see more stable outcomes. Their AI systems produce fewer surprises, require less manual correction, and scale more predictably across use cases. Just as importantly, teams spend less time fighting their data and more time using it to answer real questions.

The most effective AI initiatives tend to share a common pattern. They start by taking data seriously, not as an afterthought, but as the foundation. Well-structured and well-enriched content continues to create value long after the initial implementation. In that sense, AI-ready content is not something that happens automatically. It is engineered deliberately, maintained continuously, and treated as a long-term investment rather than a temporary requirement.

How Digital Divide Data Can Help

Digital Divide Data helps organizations transform complex, unstructured content into AI-ready assets via digitization services. Through a combination of domain-trained teams, technology-enabled workflows, and rigorous quality control, DDD supports document structuring, semantic enrichment, metadata normalization, multilingual annotation, and governance-aligned data preparation. The focus is not just speed, but consistency and trust, especially in high-stakes enterprise and public-sector environments.

Talk to our expert and prepare your content for real AI impact with Digital Divide Data.

References

Mishra, P. P., Yeole, K. P., Keshavamurthy, R., Surana, M. B., & Sarayloo, F. (2025). A systematic framework for enterprise knowledge retrieval: Leveraging LLM-generated metadata to enhance RAG systems (arXiv:2512.05411). arXiv. https://doi.org/10.48550/arXiv.2512.05411

Song, H., Bethard, S., & Thomer, A. K. (2024). Metadata enhancement using large language models. In Proceedings of the Fourth Workshop on Scholarly Document Processing (SDP 2024) (pp. 145–154). Association for Computational Linguistics. https://aclanthology.org/2024.sdp-1.14.pdf

García-Montero, P. S., Orellana, M., & Zambrano-Martínez, J. L. (2026). Enriching dataset metadata with LLMs to unlock semantic meaning. In S. Berrezueta, T. Gualotuña, E. R. Fonseca C., G. Rodriguez Morales, & J. Maldonado-Mahauad (Eds.), Information and communication technologies (TICEC 2025) (pp. 63–77). Springer. https://doi.org/10.1007/978-3-032-08366-1_5

Ignatowicz, J., Kutt, K., & Nalepa, G. J. (2025). Position paper: Metadata enrichment model: Integrating neural networks and semantic knowledge graphs for cultural heritage applications (arXiv:2505.23543). arXiv. https://doi.org/10.48550/arXiv.2505.23543

FAQs

How is AI-ready content different from cleaned data?
Cleaned data removes errors. AI-ready content adds structure, context, and meaning so systems can reason over it.

Can legacy documents be made AI-ready without reauthoring them?
Yes, through decomposition, enrichment, and annotation, although some limitations may remain.

Is this approach only relevant for large organizations?
Smaller teams benefit as well, especially when they want AI systems to scale without constant manual fixes.

Does AI-ready content eliminate hallucinations completely?
No, but it significantly reduces their frequency and impact.

How long does it take to build an AI-ready content pipeline?
Timelines vary, but incremental approaches often show value within months rather than years.

How to Structure and Enrich Data for AI-Ready Content Read Post »

Scroll to Top